GCSE Economics: State vs Private Results
GCSE economics state vs private results explained: what 2025 grade data shows, why comparisons are limited, and how students should interpret the gap.
A school-type comparison can feel personal surprisingly quickly. One set of grades rises above another on a chart, and it is tempting to read the result as a forecast of your own future.
The short answer on gcse economics state vs private results is more careful: independent schools achieve higher GCSE grades overall, but the main national publications do not provide a straightforward, like-for-like table isolating GCSE Economics outcomes in state and private schools. The available figures show an overall school-type attainment gap and national Economics results. They do not prove how large the Economics-specific gap is, nor that school type caused it.
That distinction matters. Data can describe a pattern without explaining every reason behind it, and it certainly cannot decide the grade of an individual student.
What to check before trusting the comparison
A useful GCSE Economics comparison should answer these questions:
- Does the dataset report Economics separately from all GCSE subjects?
- Does it cover England, Wales, Northern Ireland or the whole UK?
- Are the figures based on students, entries or schools?
- How are “state” and “private” schools defined?
- Are selective schools separated from non-selective schools?
- Does the comparison account for prior attainment and pupil background?
- Are the cohorts large enough to support a confident conclusion?
If several answers are missing, treat the result as descriptive rather than causal.
 A student asks a detective bar chart for more context before comparing schools
What the latest GCSE Economics data shows
The latest complete summer results available at the time of writing are for 202520252025. The Joint Council for Qualifications reported 7,6087{,}6087,608 GCSE Economics entries across the UK. Approximately 33.1%33.1\%33.1% of those results were at grade 777 or above, while about 82.2%82.2\%82.2% were at grade 444 or above.
| GCSE Economics measure | UK result for 202520252025 |
|---|---|
| Number of entries | 7,6087{,}6087,608 |
| Grade 777 or above | 33.1%33.1\%33.1% |
| Grade 444 or above | 82.2%82.2\%82.2% |
These figures tell us that GCSE Economics had a relatively small national entry compared with major compulsory subjects. They also provide useful overall benchmarks.
However, the published JCQ subject table combines centres rather than dividing Economics results neatly into state and independent sectors. You cannot take the national Economics percentage and infer the two school-type percentages hidden inside it.
This is the central limitation. A national subject average answers, “How did all GCSE Economics entries perform?” It does not answer, “How much better or worse did each school sector perform in Economics?”
Do private schools achieve higher GCSE grades overall?
Yes. Official Ofqual statistics for England show a substantial aggregate difference between centre types across GCSE subjects. In summer 202520252025, independent schools recorded 48.1%48.1\%48.1% of GCSE results at grade 777 or above and 89.6%89.6\%89.6% at grade 444 or above. The corresponding proportions for non-selective state school categories were lower.
This supports a broad conclusion: independent-school GCSE results are higher overall.
It does not support a more precise claim that the gap is identical in Economics. Overall results combine subjects with very different entry patterns, cohort sizes and grade distributions. A whole-sector figure is not automatically a subject-specific figure.
In statistical language, the two pieces of information have different levels of aggregation:
- the JCQ data describes GCSE Economics across all participating centres;
- the Ofqual data describes all GCSE results within centre categories.
Joining them casually would create a comparison the source data does not actually make.
Students developing their data skills can strengthen the same habits through MathsGenie GCSE maths revision, particularly topics involving percentages, averages, sampling and statistical diagrams.
Why the headline gap needs context
School type is associated with many other variables. When those variables are mixed together, a raw comparison cannot tell us which factor produced the difference.
Prior attainment is not controlled
Pupils do not necessarily begin secondary school with identical attainment profiles. If two cohorts have different starting points, comparing only their final grades hides part of the story.
A stronger analysis would consider progress as well as outcomes. Conceptually, progress can be represented as:
progress measure=final attainment−prior attainment benchmark\text{progress measure}=\text{final attainment}-\text{prior attainment benchmark}progress measure=final attainment−prior attainment benchmarkThis is not a complete educational model, but it illustrates why final grades alone cannot measure a school's contribution.
Selection can affect the cohort
Some independent schools are academically selective. Some state schools, including grammar schools, are selective too. Meanwhile, many schools in both sectors are non-selective.
A private-versus-state label therefore combines schools operating under quite different admissions arrangements. If selection is not separated from funding type, the comparison may partly reflect who entered the school rather than only what happened inside it.
Economics entries are not randomly assigned
GCSE Economics is an optional subject and is not offered by every school. Schools choose which courses to provide, while pupils make option choices within the available timetable.
The Economics cohort may consequently differ between sectors in ways that an all-subject comparison cannot reveal. Schools might also follow different specifications from AQA, Pearson Edexcel, OCR or Eduqas, depending on what they offer.
Entries are not always the same as pupils
Published examination tables commonly count results or entries. One pupil contributes several GCSE results across different subjects. A table of entries should not be described as though it were necessarily a table of unique students.
The basic percentage calculation is:
percentage at a grade threshold=entries meeting the thresholdtotal entries×100\text{percentage at a grade threshold}=\frac{\text{entries meeting the threshold}}{\text{total entries}}\times 100percentage at a grade threshold=total entriesentries meeting the threshold×100The denominator is essential. A percentage without a clear denominator is difficult to interpret and easy to misuse.
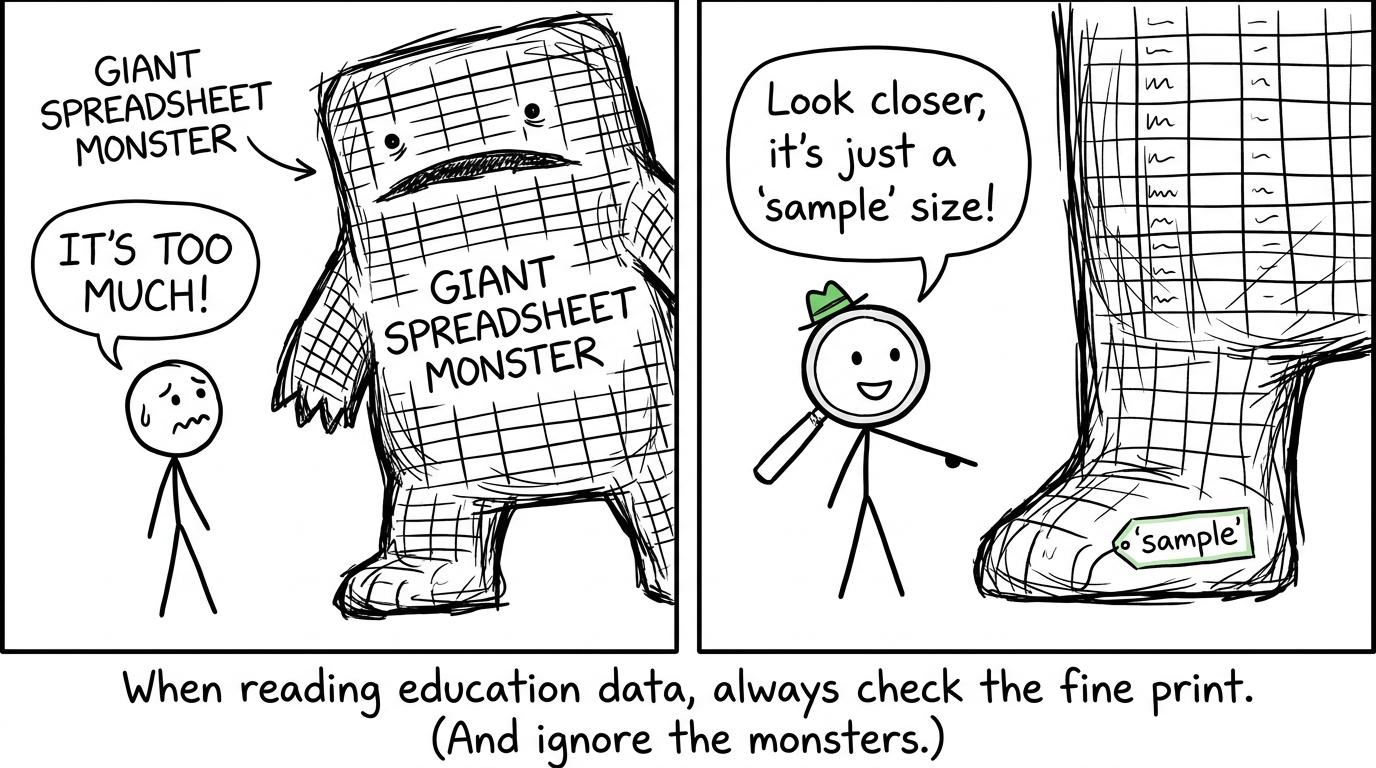 A spreadsheet monster becomes less frightening when a student notices the sample label
What the results do not tell you
The published figures do not establish that paying fees causes higher grades. They also do not measure, by themselves:
- the quality of an individual Economics teacher;
- how much revision each student completed;
- differences in prior attainment;
- household income or access to tutoring;
- admissions policies and academic selection;
- the number of lesson hours provided;
- whether every school entered comparable pupils;
- how individual schools within each sector varied.
This is the difference between correlation and causation. If school type and attainment move together, they are associated. To claim causation, an analysis would need to address plausible alternative explanations and compare suitably similar groups.
Averages also conceal variation. There are high-performing state schools and independent schools whose results sit below their sector average. Knowing the average for a category does not reveal every value inside that category.
For maths students, this is the same disciplined thinking required when interpreting distributions: centre matters, but so do spread, sample composition and the way data was collected. GCSE past papers and mark schemes provide regular opportunities to practise that judgement in exam-style questions.
How maths helps you read education statistics
Economics and maths share a useful principle: the calculation is often easier than deciding what the result means.
When comparing two proportions, the percentage-point difference is:
percentage-point difference=pprivate−pstate\text{percentage-point difference}=p_{\text{private}}-p_{\text{state}}percentage-point difference=pprivate−pstateA relative percentage difference answers a different question:
relative difference=pprivate−pstatepstate×100\text{relative difference}=\frac{p_{\text{private}}-p_{\text{state}}}{p_{\text{state}}}\times 100relative difference=pstatepprivate−pstate×100These measures should not be confused. Nor should either be calculated for GCSE Economics unless trustworthy sector-specific Economics proportions are available.
The wider lesson is valuable for GCSE and A Level maths: inspect the labels before using the numbers. Check the year, geographical coverage, category definition, sample size and denominator. Then ask whether the conclusion is descriptive or causal.
You can build those skills through MathsGenie's free GCSE revision resources, followed by timed GCSE predicted papers. Students moving beyond GCSE can continue with A Level maths revision and A Level past papers.
What this means for your own GCSE preparation
Sector averages are useful for understanding education at population level. They are poor personal predictions.
Your grade is determined through the marks you earn on your papers, not by inserting your school's category into a national table. The practical response is therefore the same in either sector:
- learn the required content from your specification;
- practise retrieving ideas without notes;
- answer questions under timed conditions;
- compare your work with official mark schemes;
- record recurring errors;
- revisit weak topics deliberately.
Maths revision works in much the same way. A broad national trend may be interesting, but your next completed question reveals more about what you should do tomorrow. Use grade boundaries and exam information carefully too: boundaries translate marks into grades for a particular paper and series, rather than guaranteeing what a future boundary will be.
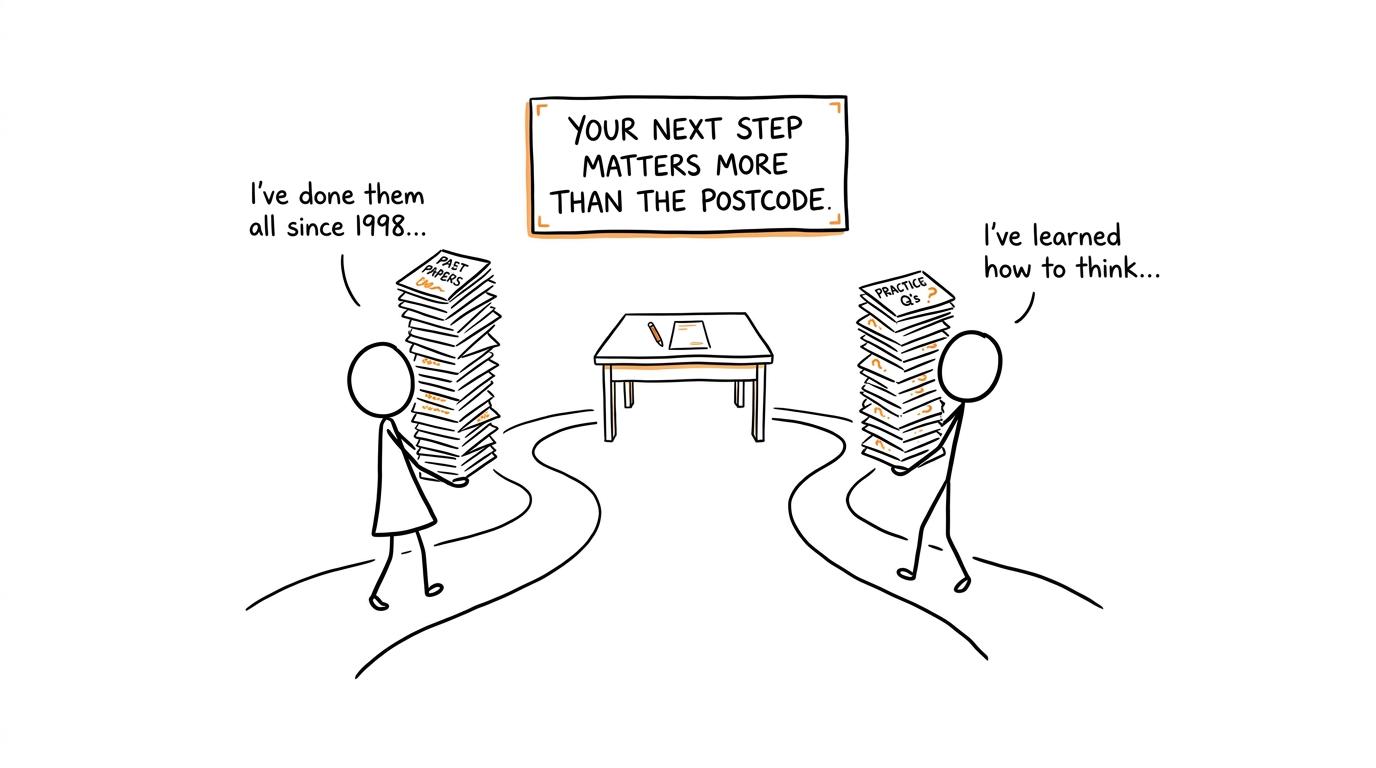 Two students take different revision paths towards the same exam desk
Common mistakes when comparing school results
Treating overall GCSE figures as Economics figures
An all-subject school-type statistic cannot be relabelled as a GCSE Economics statistic. The subject mix and entry population are different.
Assuming correlation proves causation
Higher independent-school outcomes do not isolate the effect of fees, teaching or resources. Selection, prior attainment and pupil background may all contribute.
Ignoring geography and year
UK, England-only and regional tables are not interchangeable. Results from different examination years may also reflect different cohorts and grade standards.
Comparing percentages without entry totals
A high percentage from a small cohort may be less stable than a similar percentage from a much larger cohort. Always look for the denominator.
Turning group data into a personal forecast
A sector average describes a group. It neither guarantees nor limits one pupil's result.
The most honest conclusion
Private schools achieve higher GCSE grades overall, and the latest official data continues to show a clear aggregate school-type gap. Yet the available headline publications do not tell us exactly how large that gap is for GCSE Economics alone.
That is not an unsatisfying answer. It is what responsible interpretation looks like: say what the evidence supports, identify what it cannot establish, and resist filling the gap with assumptions.
Your own next step is more concrete. Choose a weak maths topic on MathsGenie's GCSE revision page, complete the practice questions, check the video solution or mark scheme, and then test yourself with past or predicted papers. School-type statistics describe populations. Consistent, well-directed practice changes what happens on your paper.