GCSE Economics Predicted Grades Accuracy Explained
GCSE economics predicted grades accuracy explained: discover how reliable forecasts are, why results differ and how to build a stronger evidence-based estimate.
A predicted grade can feel strangely permanent. One number appears on a report, and suddenly it seems to describe your ability, your options and even results day. It does none of those things.
The short answer on GCSE economics predicted grades accuracy is that predictions are useful estimates, but they are not reliably exact for every student. Broad GCSE research suggests that forecasts are often close to the final result, commonly within one grade, yet exact matches are much less dependable. Predictions also tend to be optimistic more often than pessimistic.
That does not mean your predicted grade is meaningless. It means you should read it as a forecast based on the evidence available at one moment, not as a result already decided.
Predicted grades at a glance
Before accepting any forecast, check:
- what your school means by a predicted grade
- whether it is based on full papers or short topic tests
- whether the assessments matched your exam board's specification
- how consistently you have performed across different papers
- whether mark schemes and realistic grade boundaries were used
- how much time remains for your performance to change
Most importantly, ask what evidence would move the prediction. A grade becomes more useful when it points towards an action.
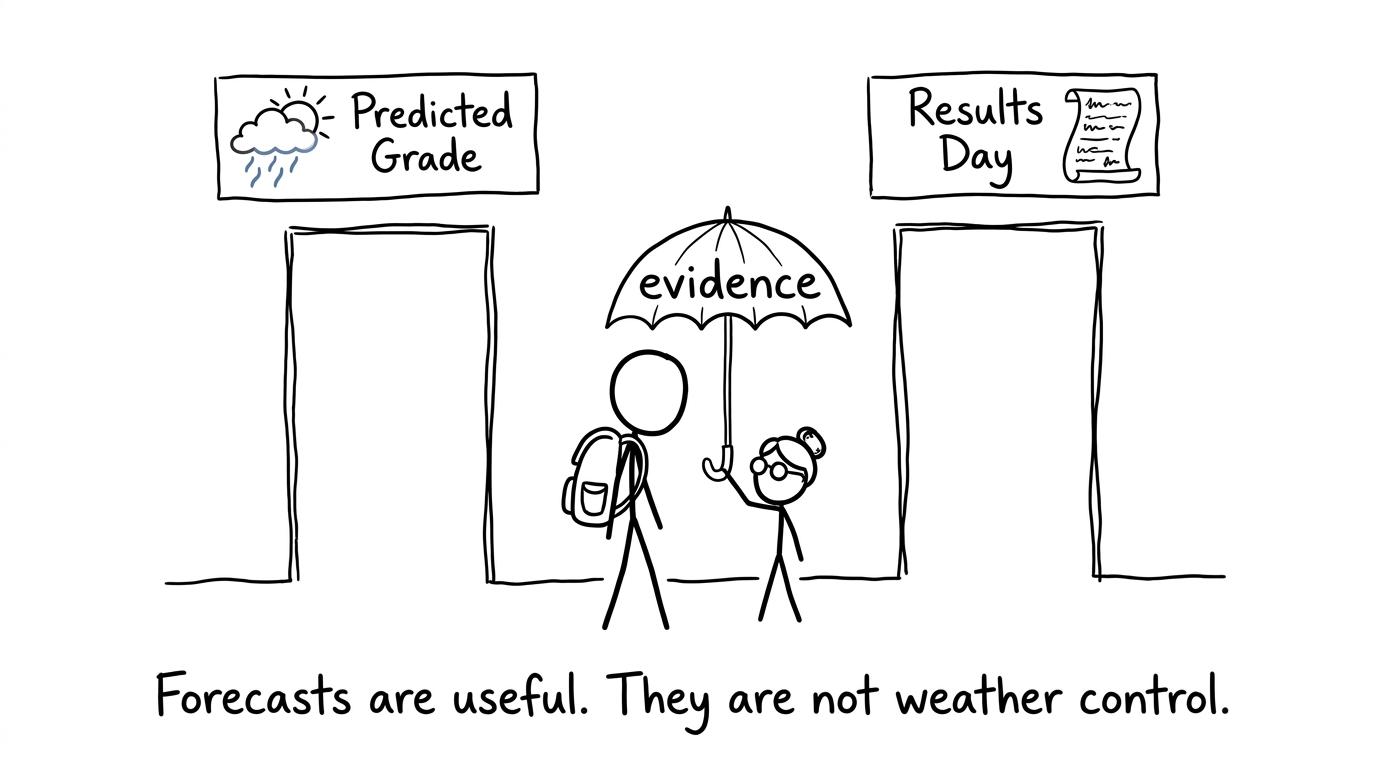 A student choosing between a predicted grade forecast and results day
How accurate are GCSE Economics predicted grades?
There is no robust, current national statistic showing the exact prediction accuracy for GCSE Economics alone across every school and exam board. Any website offering a universal percentage without explaining its data should therefore be treated cautiously.
The broader GCSE evidence gives us a more defensible picture. Historical research covering OCR GCSE forecasts across subjects found that approximately 44%44\%44% of forecasts exactly matched the awarded grade, while about 87%87\%87% were correct or within one grade. That research concerned the former letter-grade system and exams taken in 2014, so it should not be presented as a precise estimate for today's GCSE Economics qualification.
More recent Key Stage 4 analysis has found a similar underlying pattern: average predicted and achieved grades can look close across a whole cohort even when many individual predictions do not exactly match results. In most subjects examined, predictions were slightly higher on average than the grades eventually awarded.
This distinction matters. A school might predict its year group reasonably well overall while being wrong about several individual students. Group-level accuracy does not guarantee personal accuracy.
A sensible interpretation is therefore:
- an exact predicted grade is possible, but far from certain
- a one-grade range is usually more realistic than one fixed number
- repeated evidence is more trustworthy than one mock
- recent, specification-matched assessments deserve the greatest weight
What does your predicted grade actually mean?
Schools do not always use the phrase in the same way. Your report might contain a target grade, current working grade, mock grade or teacher forecast. These answer different questions.
| Grade label | What it usually describes |
|---|---|
| Target grade | A challenging outcome based partly on prior attainment or school data |
| Current working grade | The standard your recent work currently demonstrates |
| Mock grade | The grade estimated from a particular mock assessment |
| Predicted grade | A teacher's judgement of the grade you may achieve by the end of the course |
Ask your teacher which meaning applies. A target grade may intentionally sit above your current performance, while a working grade may make little allowance for future improvement. Comparing either directly with results day can create a false impression of accuracy or failure.
Why predicted grades can be higher than results day
Predictions often include expected progress
A teacher may reasonably expect your knowledge, timing and exam technique to improve before the final examination. If that improvement does not happen consistently, the prediction can end up above the result.
This is not necessarily careless forecasting. It may be a conditional judgement: the grade is achievable if the next stage of learning takes place.
The evidence may be too narrow
A short test on market failure cannot represent an entire Economics course. A full qualification assesses knowledge, application, analysis, evaluation and quantitative skills across a much wider specification.
For current AQA GCSE Economics, the final result comes from two written papers worth 808080 marks each. OCR GCSE Economics also uses two externally assessed papers worth 808080 marks each. A classroom assessment covering only one topic or one style of question is therefore a small sample of a 160160160-mark qualification.
Performance may also vary between multiple-choice questions, calculations, data interpretation and extended responses. A prediction built mainly from your strongest format can be too generous.
Mock conditions may not match the real examination
Some mocks use adapted questions, generous timings or content that students have revised very recently. Others are deliberately difficult. Unless the paper, timing and marking closely reflect the specification, its grade is only an approximation.
Final grade boundaries are not known in advance. Ofqual explains that exam boards set them after papers have been taken and marked, using evidence about paper difficulty and the standard of students' work. Past boundaries can help interpret a mock, but they cannot reveal the future boundary exactly.
Small mark changes can cross a boundary
A predicted grade compresses a detailed performance into one digit. Two scripts separated by only a few marks can sit on opposite sides of a boundary.
That makes borderline predictions especially fragile. A student predicted a grade 666 may be performing within a plausible grade 555 to 666 range rather than at one perfectly stable level.
Why predicted grades can be lower than results day
Predictions can miss improvement because learning is not always smooth. A student may remain at the same level for several months, then become much more consistent once concepts connect and exam practice begins.
A lower prediction can also result from:
- an early mock taken before the course was completed
- absence, illness or anxiety during an assessment
- weak timing that later improves
- limited evidence from extended-response questions
- rapid progress after focused feedback
- a cautious teacher judgement near a grade boundary
A prediction cannot include work you have not done yet. That is its greatest weakness and, from a student's perspective, its greatest opportunity.
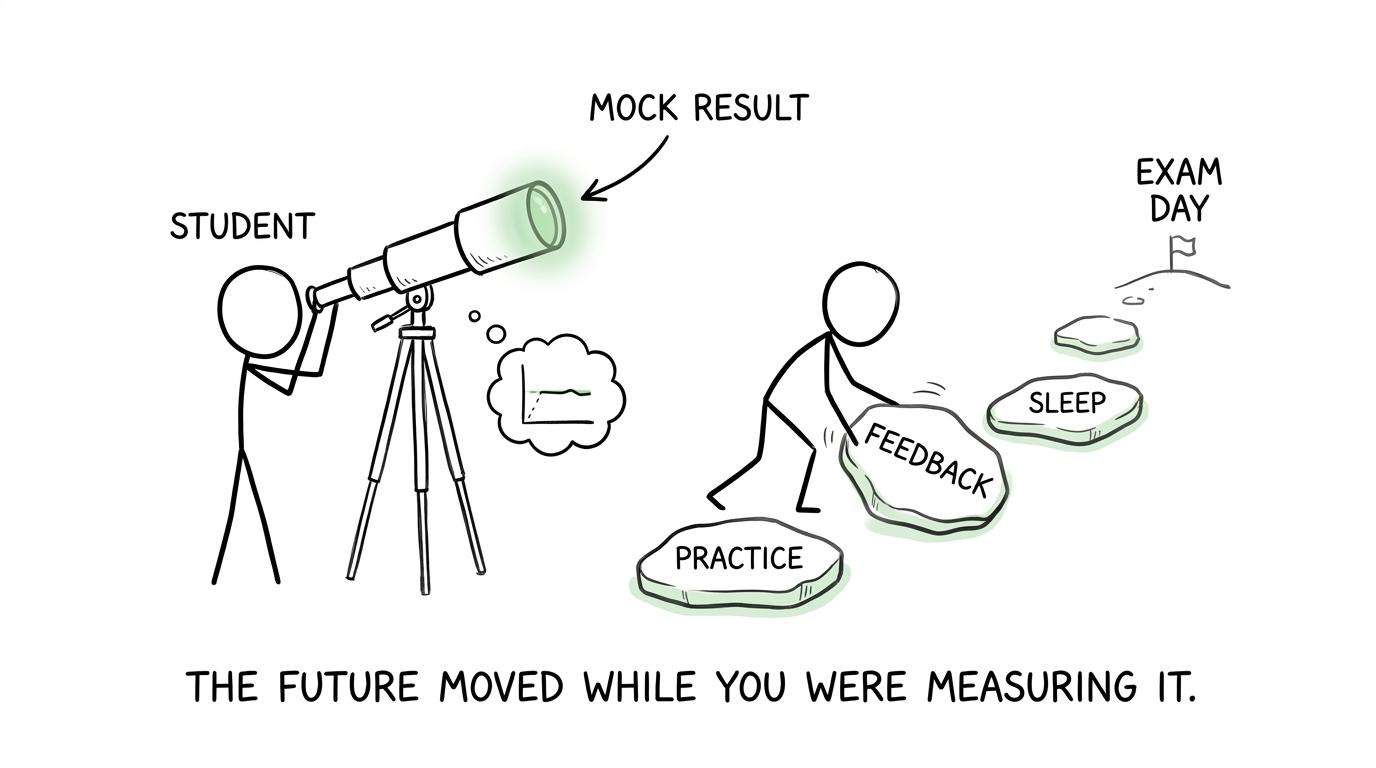 A student looking towards exam day while practice changes the path
Build a more reliable estimate from evidence
One mock mark is a snapshot. Several properly marked assessments create a trend.
Use at least three recent assessments where possible. They should cover different parts of the specification and include realistic exam conditions. For each one, record:
- the paper or topics assessed
- marks awarded and marks available
- the percentage score
- the provisional grade using boundaries from the same historical series
- lost marks by skill
- any unusual conditions that affected the result
Calculate the percentage consistently:
Percentage score=marks awardedmarks available×100\text{Percentage score}=\frac{\text{marks awarded}}{\text{marks available}}\times 100Percentage score=marks availablemarks awarded×100Then look at both the typical result and its variation. The range is:
Range=highest score−lowest score\text{Range}=\text{highest score}-\text{lowest score}Range=highest score−lowest scoreA narrow range suggests that your performance is becoming stable. A wide range tells you that the next priority is consistency, even if the average looks promising. The GCSE Statistics revision hub can help you interpret averages, spread and data without mistaking one result for a trend.
Do not combine percentages carelessly if assessments have different numbers of marks. A more defensible overall percentage uses total marks:
Overall percentage=total marks awardedtotal marks available×100\text{Overall percentage}=\frac{\text{total marks awarded}}{\text{total marks available}}\times 100Overall percentage=total marks availabletotal marks awarded×100Treat the resulting grade as a range, not a promise. Grade boundaries vary between examination series because papers vary in difficulty.
Turn the forecast into a revision decision
The useful question is not, “Will my prediction be right?” It is, “Which marks are least secure?”
Separate lost marks into categories such as knowledge, application, analysis, evaluation, calculation, data interpretation and timing. This reveals whether you need more Economics content, stronger written reasoning or better quantitative fluency.
Maths matters in Economics. Percentages, averages, ratios and graph interpretation can all affect how confidently you handle quantitative information. Use MathsGenie's percentages revision guide when percentage calculations are costing marks, then practise wider skills through the GCSE Maths revision hub.
For a repeatable routine:
- complete a timed assessment
- mark it strictly
- identify why each mark was lost
- revise the smallest relevant skill
- answer fresh questions
- retest after a short gap
MathsGenie's guide to finding your weakest GCSE topics explains how to turn lost marks into a focused plan. You can then schedule the work with the free revision planner.
Common mistakes when judging predicted grades
Treating a target as a current grade
A target describes an intended destination. It does not prove that you are already performing there. Confirm the label before drawing conclusions.
Using one unusually good or bad mock
One assessment may reflect favourable topics, tiredness or poor timing. Look for a repeated pattern across different papers.
Assuming old grade boundaries will repeat
Historical boundaries are useful reference points, not future facts. Final boundaries are set after marking, so predicted boundaries should always be treated as provisional.
Focusing only on the total mark
Two students with the same total may need completely different revision. One may lack subject knowledge; the other may understand the content but lose marks through weak evaluation or calculations.
Revising only what is expected to appear
Predicted papers are training resources, not leaked examinations. MathsGenie's GCSE predicted papers are valuable for timed maths practice, mark-scheme analysis and identifying weak areas, but they should sit alongside full specification coverage.
Your predicted grade is a compass, not a ceiling
The most honest conclusion about GCSE Economics predicted grades is that they tend to be informative without being exact. They become more reliable when they draw on several recent, specification-matched assessments. They become less reliable when they rely on one mock, unclear grade boundaries or assumptions about future progress.
So keep the forecast in perspective. Ask for the evidence behind it, track your marks and focus on what can still change.
For the quantitative skills supporting Economics and your wider GCSE preparation, make MathsGenie your revision base. Use free revision lessons and practice questions to repair weak methods, mini tests to check recall, and past papers or predicted papers to build timing. Mark everything carefully with mark schemes and video solutions. A predicted grade describes one possible future, disciplined practice helps you build a better one.