GCSE Arabic Gender Gap Results: What Data Shows
GCSE Arabic gender gap results reveal higher female outcomes in 2025. Explore national figures, their limits and lessons for smarter GCSE maths revision.
A results table can make a difference look simple: one percentage for boys, another for girls, then a gap between them. But the story behind those numbers is rarely simple. The latest GCSE Arabic gender gap results show that female candidates achieved higher outcomes than male candidates at two important grade thresholds in summer 2025. The gap was 8.78.78.7 percentage points at grade 777 or above and 8.28.28.2 percentage points at grade 444 or above.
That is a real difference in the published results. It is not, however, proof that gender itself caused the difference. For GCSE maths students, this is a useful lesson in statistical reasoning: calculate accurately, compare like with like and avoid claiming more than the evidence supports.
The results at a glance
The main findings from the Joint Council for Qualifications, or JCQ, summer 2025 data are:
- 2,5322,5322,532 male candidates and 2,7932,7932,793 female candidates sat GCSE Arabic.
- 53.9%53.9\%53.9% of male candidates achieved grade 777 or above, compared with 62.6%62.6\%62.6% of female candidates.
- 80.4%80.4\%80.4% of male candidates achieved grade 444 or above, compared with 88.6%88.6\%88.6% of female candidates.
- The female advantage was therefore 8.78.78.7 percentage points at grade 777 and 8.28.28.2 percentage points at grade 444.
- The figures describe outcomes for groups of entries. They do not predict the result of any individual student.
Students who want to strengthen the skills used to interpret these figures can begin with MathsGenie's free GCSE maths revision hub or explore the dedicated GCSE Statistics revision resources.
What the national GCSE Arabic data shows
The JCQ's UK summer 2025 table for other modern foreign languages gives the following breakdown. The official publication uses the categories male and female, so the figures technically compare results by recorded sex. The phrase “gender gap” is commonly used when discussing the pattern, but it is worth understanding what the source actually records.
| Candidate group | Number sat | Grade 777 or above | Grade 444 or above | Grade 111 or above |
|---|---|---|---|---|
| Male | 2,5322,5322,532 | 53.9%53.9\%53.9% | 80.4%80.4\%80.4% | 93.0%93.0\%93.0% |
| Female | 2,7932,7932,793 | 62.6%62.6\%62.6% | 88.6%88.6\%88.6% | 96.3%96.3\%96.3% |
| All candidates | 5,3255,3255,325 | 58.5%58.5\%58.5% | 84.7%84.7\%84.7% | 94.8%94.8\%94.8% |
Pearson's final June 2025 grade statistics also recorded 5,3235,3235,323 certificated results, a very small difference from the JCQ results-day total. Such revisions can occur as provisional results data is finalised. Pearson reported that 58.6%58.6\%58.6% achieved grade 777 or above and 84.8%84.8\%84.8% achieved grade 444 or above, effectively confirming the overall pattern.
The two sources should not be mixed within one calculation. If you compare male and female outcomes, use the figures from the same JCQ table.
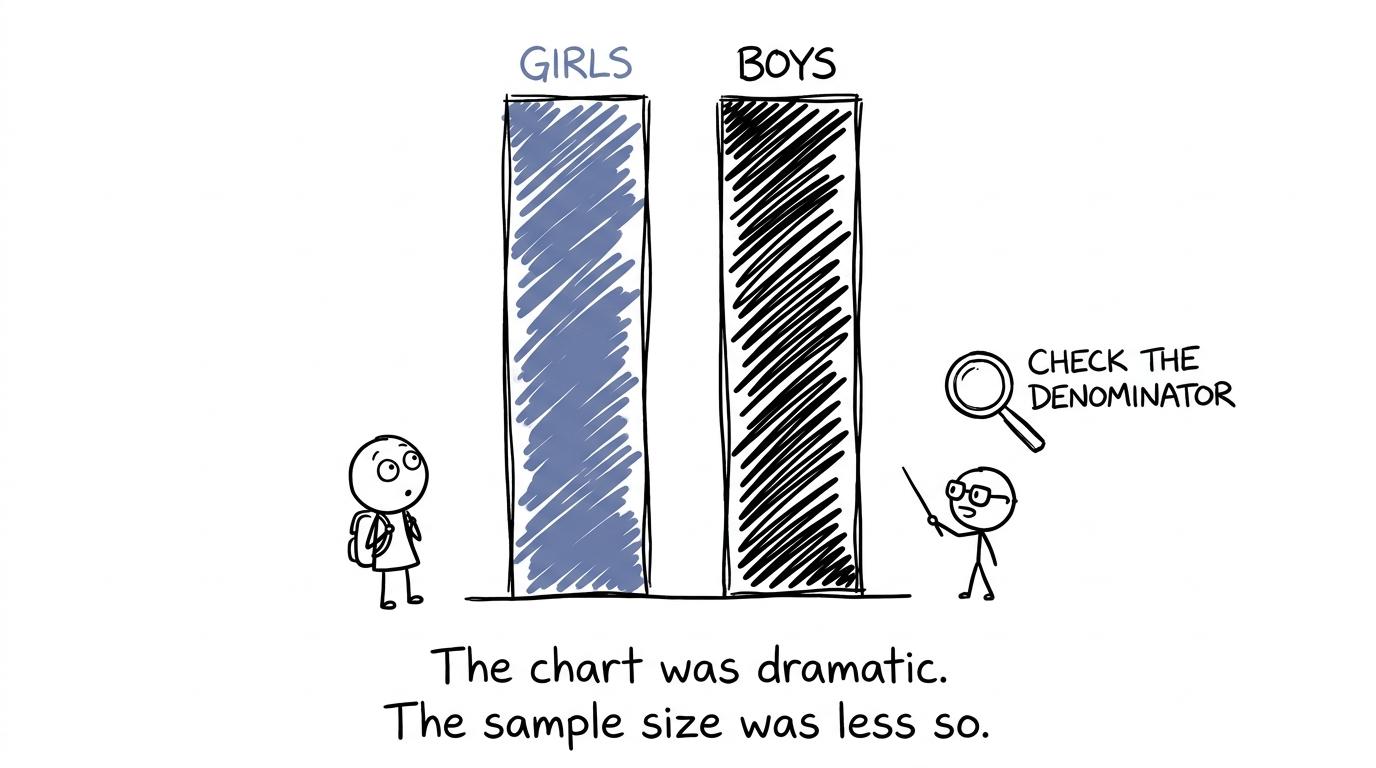 A statistician reminds students to check the denominator before trusting a dramatic chart
Measuring the GCSE Arabic results gap correctly
A percentage-point gap is found by subtracting one percentage from the other:
percentage-point gap=female percentage−male percentage\text{percentage-point gap}=\text{female percentage}-\text{male percentage}percentage-point gap=female percentage−male percentageAt grade 777 or above, the published gap is:
62.6%−53.9%=8.7 percentage points62.6\%-53.9\%=8.7\text{ percentage points}62.6%−53.9%=8.7 percentage pointsAt grade 444 or above, it is:
88.6%−80.4%=8.2 percentage points88.6\%-80.4\%=8.2\text{ percentage points}88.6%−80.4%=8.2 percentage pointsThese are percentage-point differences, not percentage increases. The distinction matters in GCSE maths, news reports and everyday decisions. A movement from 50%50\%50% to 60%60\%60% is a rise of 101010 percentage points, but the relative percentage increase is:
60−5050×100=20%\frac{60-50}{50}\times 100=20\%5060−50×100=20%If percentages still feel slippery, MathsGenie's percentages revision resources provide lessons, questions and revision guides for foundation and higher tier.
Has the gap changed since 2024?
JCQ's table includes the previous year's figures in brackets. In 2024, 55.5%55.5\%55.5% of male candidates and 63.1%63.1\%63.1% of female candidates achieved grade 777 or above. That produced a gap of:
63.1%−55.5%=7.6 percentage points63.1\%-55.5\%=7.6\text{ percentage points}63.1%−55.5%=7.6 percentage pointsThe 2025 gap of 8.78.78.7 percentage points was therefore 1.11.11.1 percentage points wider at this threshold.
At grade 444 or above, the 2024 figures were 80.2%80.2\%80.2% for male candidates and 88.0%88.0\%88.0% for female candidates, giving a gap of 7.87.87.8 percentage points. The 2025 gap was 8.28.28.2 percentage points, an increase of 0.40.40.4 percentage points.
One year of movement does not establish a lasting trend. Results can change because the cohort, prior experience, entry decisions and distribution between foundation and higher tier change. A convincing trend requires several comparable years of evidence, not two points joined by a confident line.
That principle appears throughout GCSE statistics. MathsGenie's scatter graphs resources help students distinguish an observed association from a causal explanation.
Why the figures do not explain the cause
The national table tells us what happened, but not why it happened. It does not provide a gender breakdown for prior attainment, home use of Arabic, teaching time, attendance, school context or tier of entry. Without those variables, none can be identified as the cause of the gap.
Pearson Edexcel GCSE Arabic assesses four skills: listening, speaking, reading and writing. Each contributes 25%25\%25% of the qualification. Candidates take either foundation or higher tier across the papers. The published headline results do not show whether the observed gap arose mainly in one skill, appeared across all four, or reflected different tier-entry patterns.
This is why statements such as “girls are naturally better at languages” are not supported by the data. Group averages combine thousands of individual stories. They cannot identify an innate difference, and they hide the considerable overlap between the two groups.
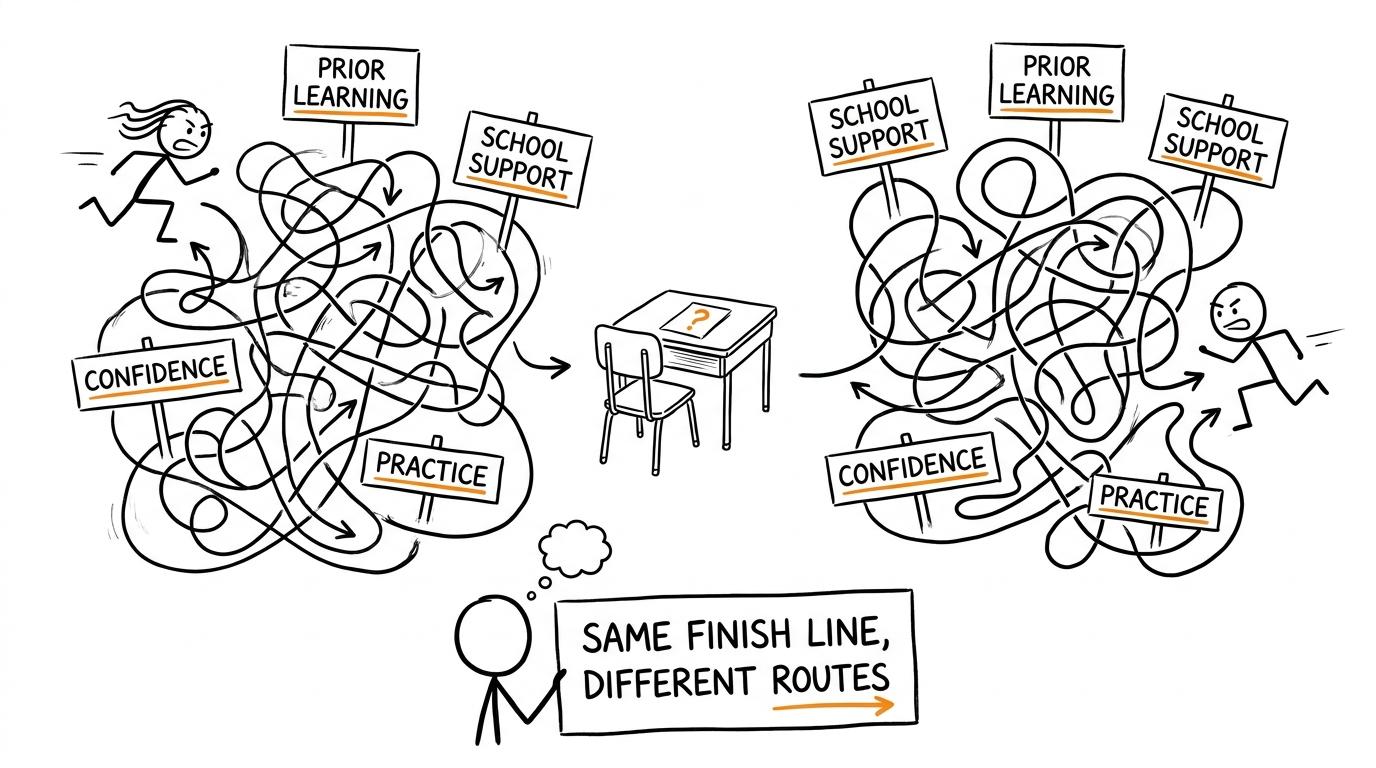 Two students reach the same exam through different mazes of prior learning and support
How GCSE maths students should read results data
Although the subject here is Arabic, the reasoning belongs squarely inside GCSE maths. Questions involving percentages, tables, averages, samples and misleading conclusions appear across Edexcel, AQA, OCR and Eduqas specifications.
Check the population
Ask whether the data covers the UK, England, one exam board, one school or only 161616-year-olds. These populations are not interchangeable. The JCQ Arabic table covers UK GCSE results, while Ofqual's frequently quoted overall gender figures often refer specifically to 161616-year-olds in England.
Compare rates rather than raw totals
There were more female Arabic entries than male entries in 2025. Raw counts of high grades would therefore be influenced by both attainment and cohort size. Percentages create a fairer comparison between groups of different sizes.
The percentage in a group is calculated using:
percentage=number meeting the conditiontotal number in the group×100\text{percentage}=\frac{\text{number meeting the condition}}{\text{total number in the group}}\times 100percentage=total number in the groupnumber meeting the condition×100Look beyond one threshold
Grade 777 and grade 444 answer different questions. Grade 777 or above describes higher attainment, while grade 444 or above is commonly treated as a standard pass. A complete reading checks both rather than selecting whichever produces the most dramatic headline.
Separate correlation from causation
The data shows an association between recorded sex and outcome in this cohort. It does not demonstrate that one variable caused the other. Learning to write that distinction clearly can earn marks in statistics questions.
For broader practice, use MathsGenie's Edexcel GCSE Statistics resources, including exam-style questions, worksheets and past papers.
What this means for your own revision
National averages can describe a cohort, but they cannot sit your exam. Your result is more directly affected by the work you can control: identifying weak topics, practising retrieval, completing exam questions and correcting mistakes carefully.
A calm revision cycle is:
- complete a short test or paper section;
- mark it honestly;
- classify each lost mark by topic or error type;
- revisit the relevant lesson;
- practise similar questions;
- retest after a short gap.
The Edexcel GCSE Maths mini tests make that cycle manageable. When you are ready for longer practice, use Edexcel GCSE Maths past papers with the correct tier, timing and mark scheme.
 A past-paper machine gives a student the strangely reassuring instruction to revise percentages
Common mistakes when discussing gender gaps
Confusing percentages with percentage points
The difference between 62.6%62.6\%62.6% and 53.9%53.9\%53.9% is 8.78.78.7 percentage points. Calling it an 8.7%8.7\%8.7% increase changes the mathematical meaning.
Comparing different populations
A UK all-candidate Arabic figure should not be directly compared with an England-only figure for 161616-year-olds as though the samples were identical.
Treating association as proof of cause
The results table contains no evidence that gender itself produced the gap. Other variables were not controlled in this descriptive data.
Ignoring entry numbers
Different group sizes make raw totals less useful than within-group percentages. Always identify the denominator before drawing a conclusion.
Assuming an average predicts an individual
A female candidate is not guaranteed a higher result, and a male candidate is not restricted by the group average. The data describes cohorts, not personal limits.
A careful conclusion from the 2025 results
Yes, the 2025 national results show a measurable GCSE Arabic outcome gap: female candidates had higher percentages at grades 777, 444 and 111 or above. The clearest headline differences were 8.78.78.7 percentage points at grade 777 or above and 8.28.28.2 percentage points at grade 444 or above.
The responsible conclusion stops there. The published figures establish a difference, not its cause. They should prompt better questions about cohorts, entry patterns and learning experiences rather than stereotypes about ability.
For your own GCSE maths preparation, turn the same statistical discipline inward. Gather evidence from your work, find the topics costing you marks and respond with focused practice. MathsGenie brings together free revision lessons, practice questions, mini tests, past papers, predicted papers, mark schemes and video solutions. Start with the Edexcel predicted papers, then let your results decide what you revise next.