

A-Level Results: Independent vs State Schools
A-level results independent vs state school data explained using the latest national figures, with context on centre types, grades and fair comparisons.

Results day produces a strange kind of certainty. Within hours, national averages become headlines and school-type gaps become verdicts. Yet the a-level results independent vs state school comparison needs more care than a single chart suggests.
The latest complete results-day data available as of July 2026 covers summer 2025. In England, Ofqual reported that independent schools had a higher proportion of A-level entries awarded grades A∗A^*A∗ or AAA than state-funded centres. That is an important finding, but it does not prove that school type alone caused the difference. The figures describe exam entries at centres, not matched groups of otherwise identical students.
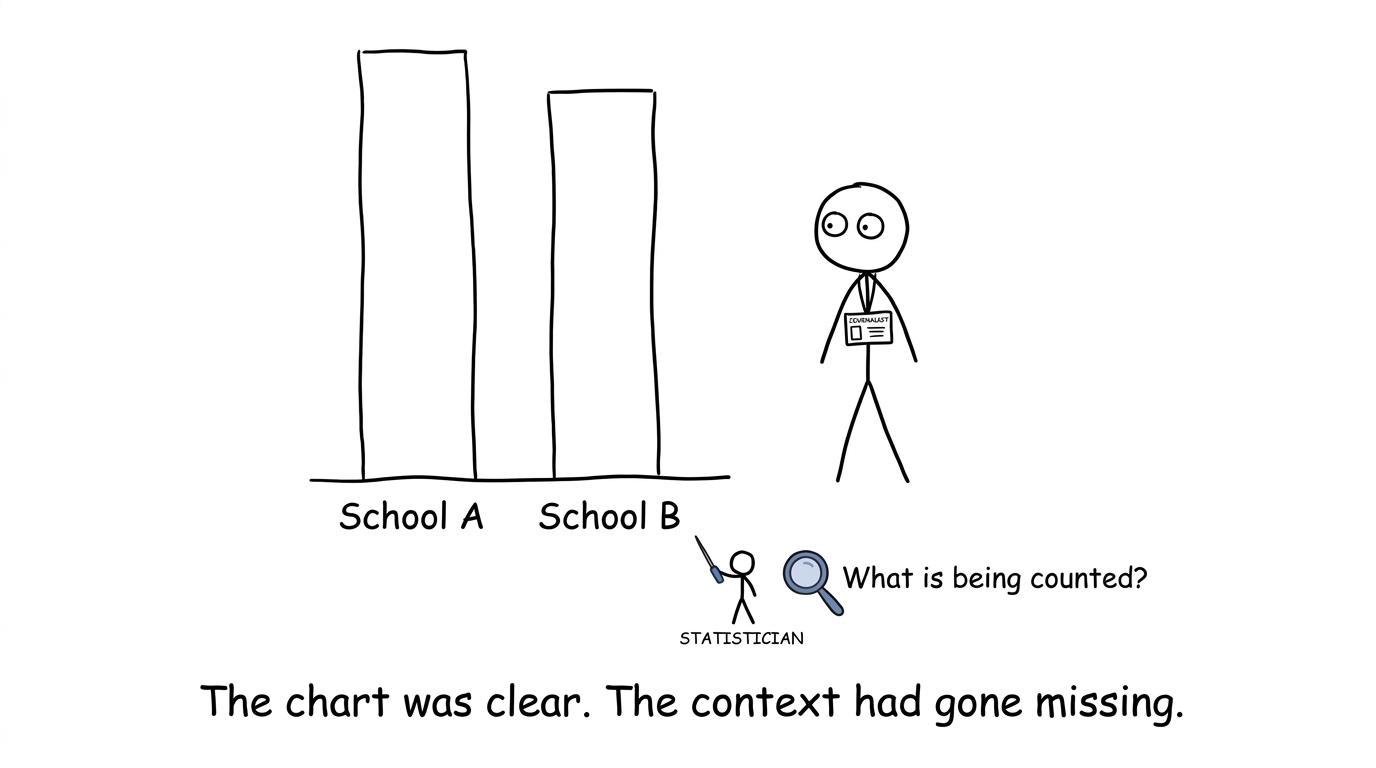
For parents, prospective A-level students and journalists, the useful question is therefore not only, “Which percentage is higher?” It is also, “What exactly has been counted?”
The national results checklist
Before comparing school type A-level outcomes, check:
- whether the data covers England or the whole UK
- whether it counts entries, students or institutions
- which schools and colleges sit inside each category
- whether the threshold is A∗A^*A∗ to AAA, A∗A^*A∗ to CCC or A∗A^*A∗ to EEE
- whether subject mix, prior attainment and selection have been considered
- whether percentages come from official results-day data or individual school publicity
These checks turn a dramatic statistic into a meaningful one.
 A journalist searches for the missing context behind a school results chart
What the latest A-level national results comparison shows
Ofqual's summer 2025 release reports results issued by schools and colleges in England. Its combined school-type figures were:
| Centre type | Entries at grade AAA or above | Entries at grade CCC or above |
|---|---|---|
| All state-funded centres | 25.2%25.2\%25.2% | 76.3%76.3\%76.3% |
| Independent schools, including CTCs | 48.4%48.4\%48.4% | 89.7%89.7\%89.7% |
The gap at grade AAA and above was therefore 23.223.223.2 percentage points. At grade CCC and above, it was 13.413.413.4 percentage points.
Across all A-level entries in England, 28.2%28.2\%28.2% received A∗A^*A∗ or AAA in 2025, compared with 27.6%27.6\%27.6% in 2024 and 25.2%25.2\%25.2% in 2019. These are entry-level proportions: a student taking three A levels contributes three results.
That distinction matters. “Almost half of independent-school entries received top grades” is supported by the data. “Almost half of independent-school pupils received all top grades” is not the same claim and cannot be inferred from this table.
State-funded education is not one uniform group
The state total combines several types of centre with noticeably different outcomes.
| State-funded centre type | Entries at grade AAA or above |
|---|---|
| Secondary selective schools | 43.7%43.7\%43.7% |
| Free schools | 31.3%31.3\%31.3% |
| Sixth-form colleges | 24.0%24.0\%24.0% |
| Academies | 23.1%23.1\%23.1% |
| Comprehensive or middle schools | 22.6%22.6\%22.6% |
| Secondary modern or high schools | 16.3%16.3\%16.3% |
| Further education establishments | 14.4%14.4\%14.4% |
A selective state school was much closer to the independent-school figure than an FE establishment was to the overall state average. Consequently, “state versus independent” is useful as a national summary but weak as a complete description of England's varied post-16 system.
Ofqual categorises results using the centre where the examination was taken. Centre types are largely based on information recorded through the National Centre Number system, with adjustments made to improve the identification of selective schools. The data should therefore be described as outcomes by centre type, not a controlled estimate of the effect of attending a particular kind of school.
Why the figures cannot establish cause
Independent and state-funded centres may differ in admissions, students' earlier attainment, subject choices, local context and cohort size. Selective schools also admit academically selected cohorts. These factors can affect the grade distribution before differences in teaching or resources are considered.
Subject mix deserves particular attention. A combined percentage weights every entry, so subjects with more entries influence the total more heavily. It does not compare like-for-like pupils taking identical combinations under identical circumstances.
This does not make the school-type data unhelpful. It changes the conclusion. The evidence shows an association between centre type and the 2025 distribution of grades. It does not isolate a single reason for that association.
For a family choosing a sixth form, national percentages should sit alongside course availability, entry requirements, teaching stability, pastoral support, travel and the student's preferred learning environment. One national average cannot describe every school within its category.
What GCSE maths students should take from the data
For GCSE students considering A-level Maths, these figures are context rather than destiny. A national category does not determine an individual's result. Preparation remains specific: understand the specification, practise unfamiliar questions, review errors and learn how mark schemes award marks.
Start with the GCSE Maths revision hub, then explore the A-level Maths revision hub before choosing the subject. Students following Pearson can see the transition in the Edexcel A-level Maths revision course, while Edexcel A-level Maths past papers show the standard expected under timed conditions. AQA, OCR, Eduqas and other specifications differ, so always use resources for the correct exam board.
 A student discovers that one useful next step beats staring at national averages
Common mistakes when reporting school-type results
Treating entries as pupils
One pupil can generate several A-level entries. Entry percentages do not reveal how many pupils achieved a particular three-grade combination.
Comparing England with UK-wide data
Ofqual's centre-type table covers England. JCQ also publishes broader results data, but geographic coverage must be stated before figures are placed side by side.
Calling percentage points a percentage increase
The difference between 48.4%48.4\%48.4% and 25.2%25.2\%25.2% is 23.223.223.2 percentage points. Calling it a 23.2%23.2\%23.2% increase would describe a different calculation.
Assuming every state or independent school is typical
National categories conceal substantial variation between institutions. Individual-school figures can also fluctuate when cohorts are small.
Confusing grade shares with grade boundaries
A grade share reports the proportion of entries receiving a grade. A grade boundary is the raw-mark threshold needed for that grade in a particular examination series. They answer different questions.
Read the headline, then inspect the denominator
The 2025 figures show a clear national attainment gap between independent and state-funded centres, especially at grades A∗A^*A∗ and AAA. They also show why the binary headline is incomplete: selective state schools, comprehensives, sixth-form colleges and FE establishments have different results and different cohorts.
MathsGenie helps students focus on what they can change. Use free revision lessons, practice questions, video solutions, mini tests, predicted papers and mark schemes to turn broad ambition into specific action. When results arrive, interpret the marks properly with MathsGenie's GCSE and A-level grade boundaries hub, or use the GCSE predicted grade calculator while preparing for the next stage.










