Three students were asked to estimate the population size of a wildflower species in a meadow by using a quadrat. Figure 1 shows where each student placed their quadrats in the meadow:
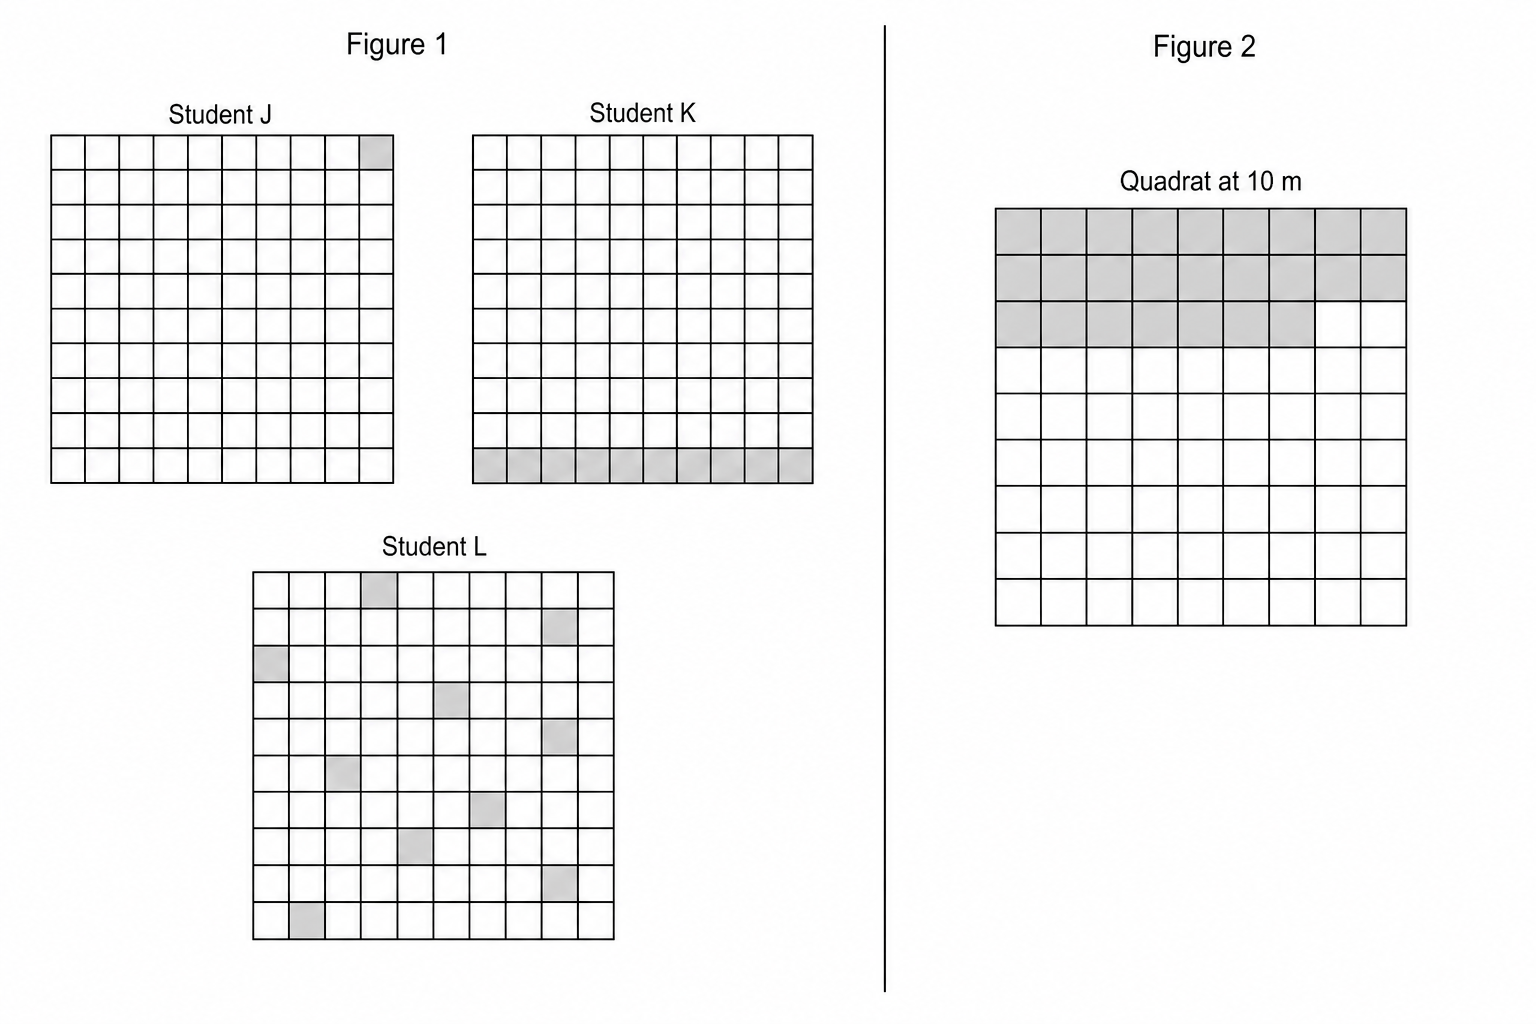
Which student would obtain the most reliable estimate? Give reasons for your answer.
State what is meant by the term population.
Five other students investigated the distribution of a saltmarsh grass species (Spartina) along a coastal saltmarsh gradient. They placed a quadrat (1 m by 1 m, divided into 100 squares of 10 cm by 10 cm) at the water's edge (0 m) and then at 5-metre intervals along a straight transect line inland. The percentage cover was recorded based on how many of the 100 squares contained the grass.
The table shows the results obtained:
Student0 m5 m10 m15 m20 mA214285588B416725285C112265891D315295486E013275690Average21427.55588\begin{array}{|c|c|c|c|c|c|} \hline \textbf{Student} & \mathbf{0\text{ m}} & \mathbf{5\text{ m}} & \mathbf{10\text{ m}} & \mathbf{15\text{ m}} & \mathbf{20\text{ m}} \\ \hline \text{A} & 2 & 14 & 28 & 55 & 88 \\ \hline \text{B} & 4 & 16 & 72 & 52 & 85 \\ \hline \text{C} & 1 & 12 & 26 & 58 & 91 \\ \hline \text{D} & 3 & 15 & 29 & 54 & 86 \\ \hline \text{E} & 0 & 13 & 27 & 56 & 90 \\ \hline \textbf{Average} & 2 & 14 & 27.5 & 55 & 88 \\ \hline \end{array}StudentABCDEAverage0 m2413025 m14161215131410 m287226292727.515 m55525854565520 m888591869088
One of the averages has been calculated by ignoring an anomalous result. Which student obtained the anomalous result?
Figure 2 shows the quadrat used by one of the students at 10 m. Which student obtained the results shown in this quadrat?