The diagram shows the distribution of two plant species in a small area of a meadow.
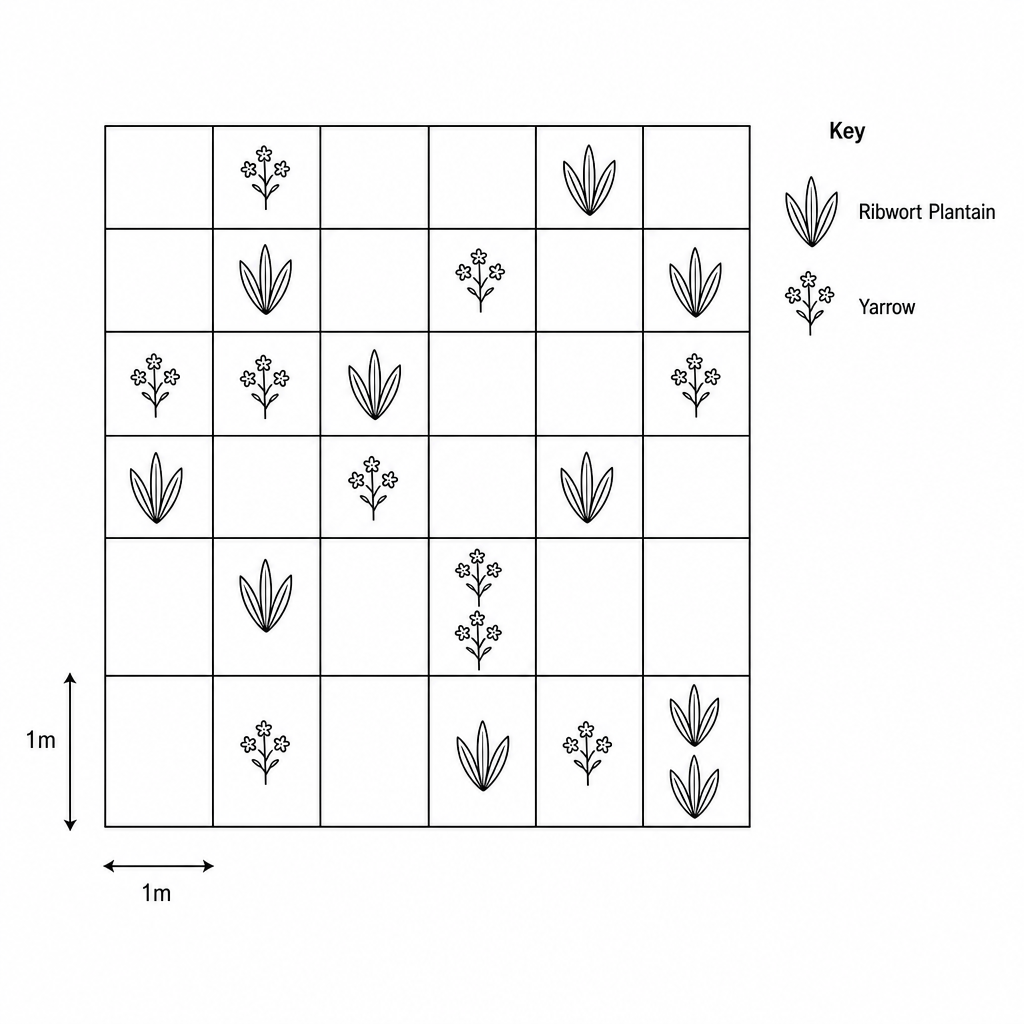
A student uses a square metal frame to help count the plants in the area.
What is the name of the square frame apparatus that the student uses?
(i) The student counts the number of plants in all of the squares he marked out in the meadow.
Complete the table below to show the number of plants of each species and the average (mean) number of plants per m2\text{m}^2m2.
| Species | Number of plants | Average number of plants per m2\text{m}^2m2 |
|---|---|---|
| yarrow | 10 | 0.28 |
| ribwort plantain |
(ii) Frequency is another measure that can be used to study distribution. Frequency is the number of squares that contain at least one plant of the species being counted. This value can also be expressed as a percentage of the total number of squares sampled.
Complete the table below by giving the frequency and percentage of the total number of squares sampled for ribwort plantain.
| Species | Frequency | Percentage (%) |
|---|---|---|
| yarrow | 9 | 25 |
| ribwort plantain |
Describe how the student could estimate the population size of ribwort plantain in a very large field.