A research team investigates the work done to drag an experimental scientific sled across a rough landing pad through a constant distance.
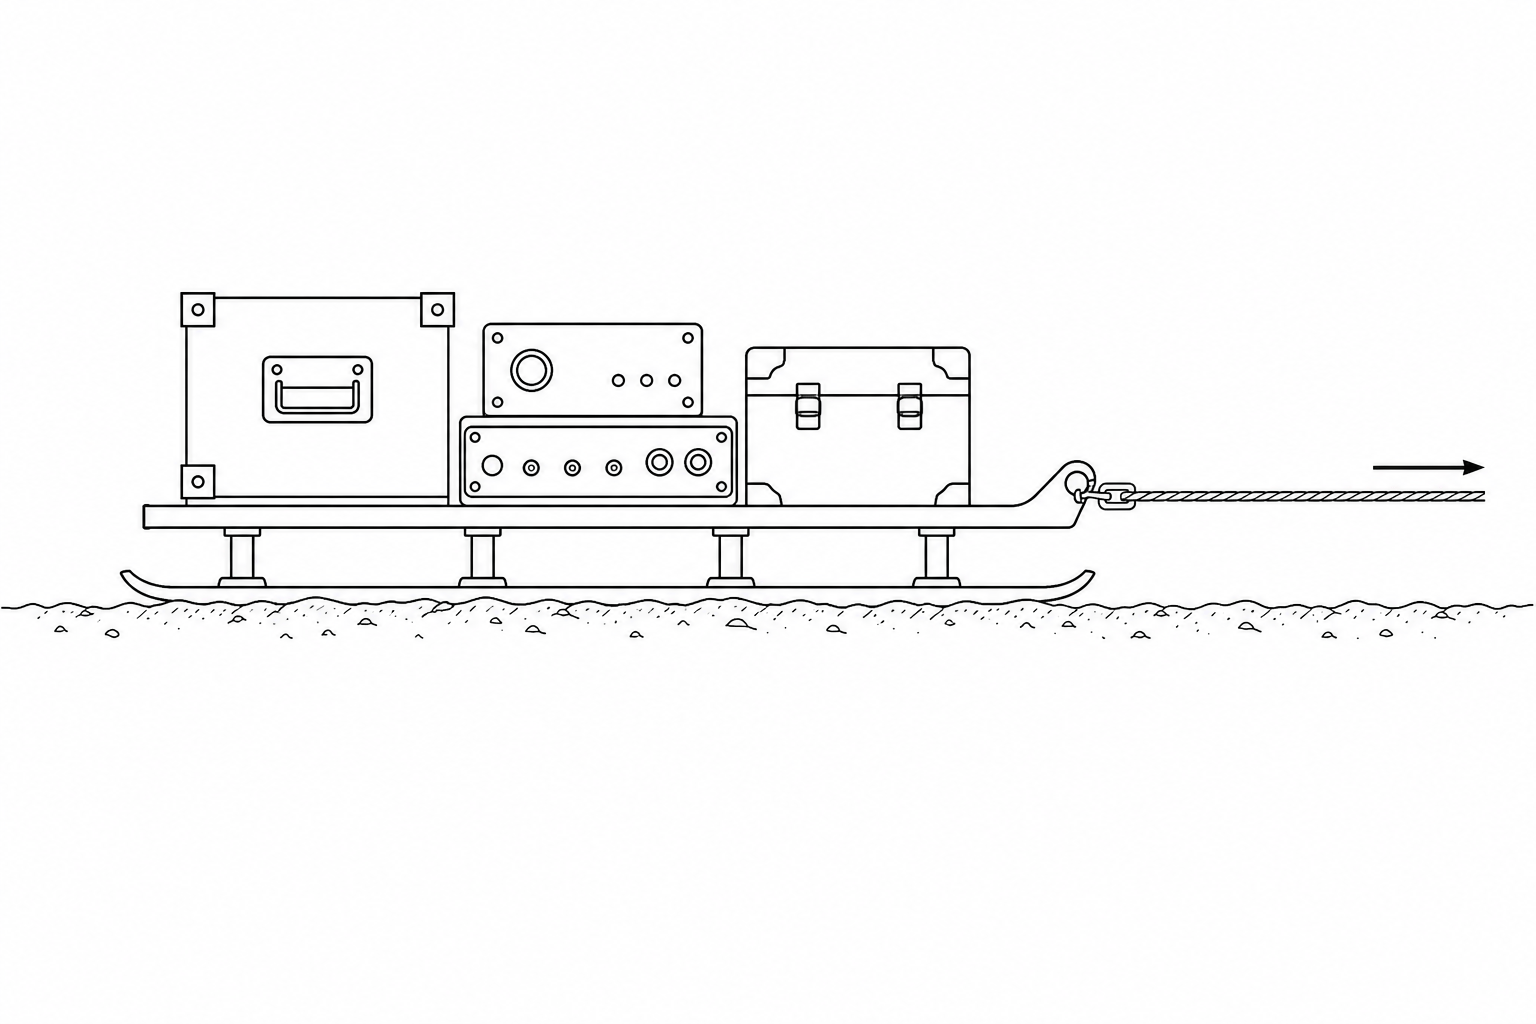
The table shows the team's measurements:
| Sled mass (kg) | Work done (J) |
|---|---|
| 2.0 | 45 |
| 4.0 | 82 |
| 6.0 | 121 |
| 8.0 | 158 |
| 10.0 | 195 |
| 12.0 | 234 |
Describe how the team can perform this experiment, including any measuring equipment used.
If this data were plotted on a graph of Work done (yyy-axis) against Sled mass (xxx-axis), describe the pattern of the plotted points and the line of best fit.
State the relationship shown by the data between the mass of the sled and the work done to drag it.
The team sprayed a low-friction polymer coating onto the landing pad surface to reduce friction, keeping the sled masses and drag distance the same.
Describe how a line representing this new coated surface (line C) would compare on the graph to the original line of best fit.
Explain the physical reason for this difference.