Motion

EasyMedium
12345678910111213141516171819202122232425262728293031323334353637383940414243
Question 41
Easy

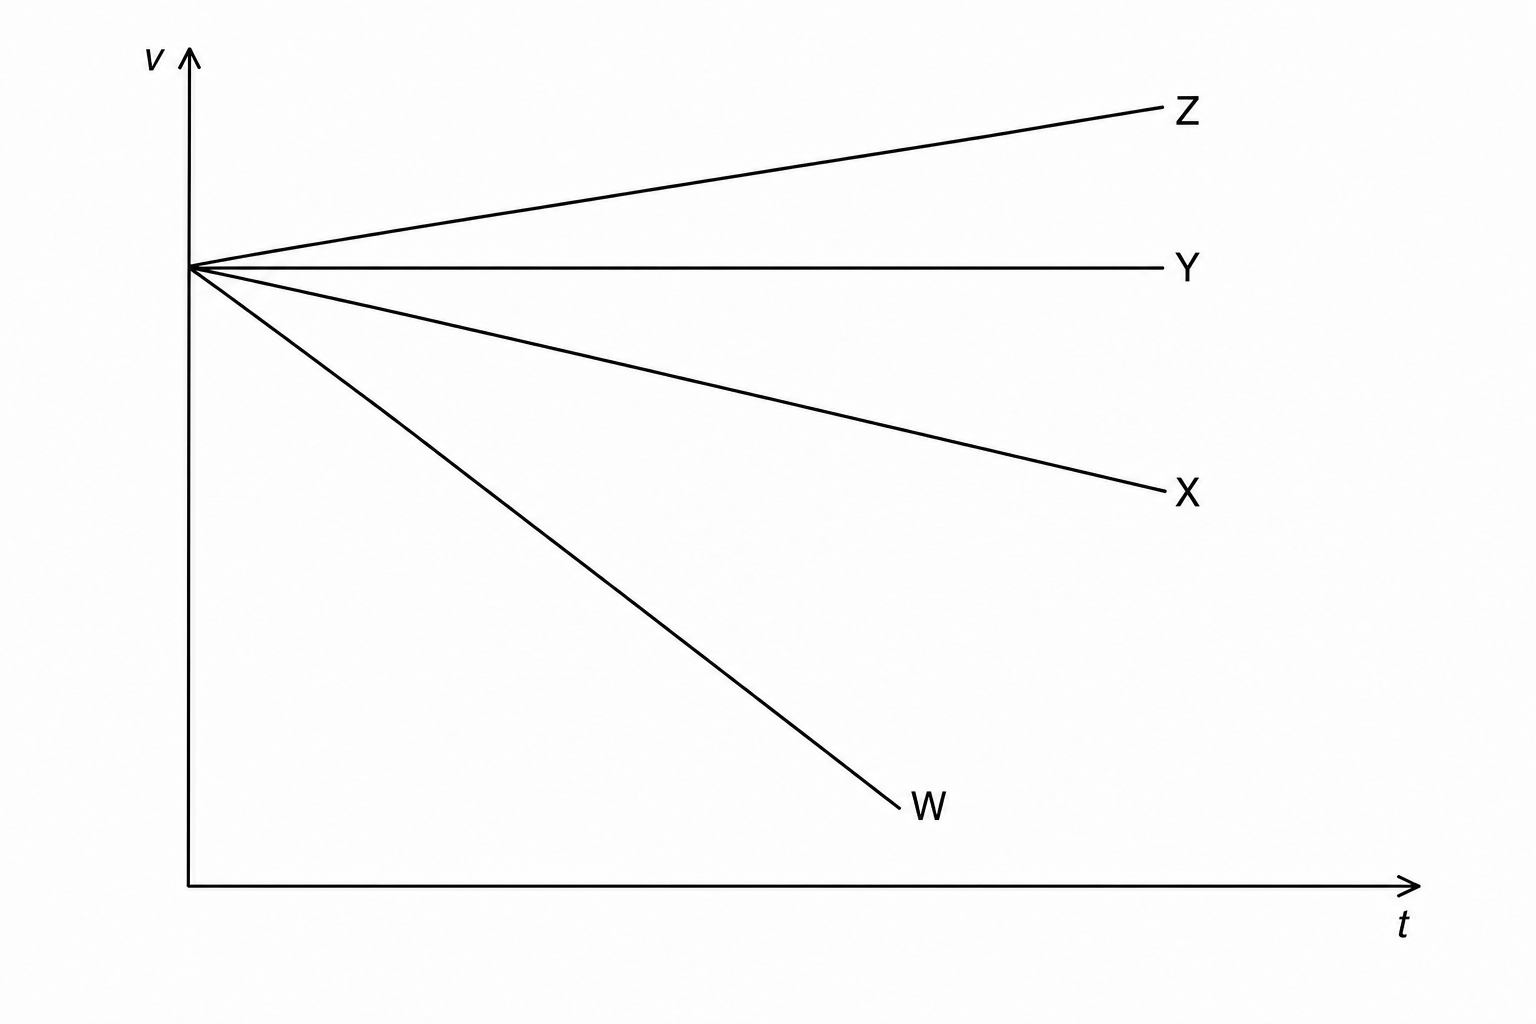
The velocity–time graph shows how the velocity of four different vehicles, labeled W, X, Y, and Z, changes over time.

A velocity-time graph with Velocity on the vertical axis and Time on the horizontal axis. Four straight lines, labeled W, X, Y, and Z, all start from the same positive value on the vertical velocity axis: Line W slopes downwards very steeply; Line X slopes downwards with a gentler slope than Line W; Line Y is horizontal and parallel to the time axis; Line Z slopes upwards relative to the starting point.

Which vehicle has the greatest deceleration?
[2]

Motion Questions

  1. GCSE
  2. /Physics
  3. /Motion