Question 2
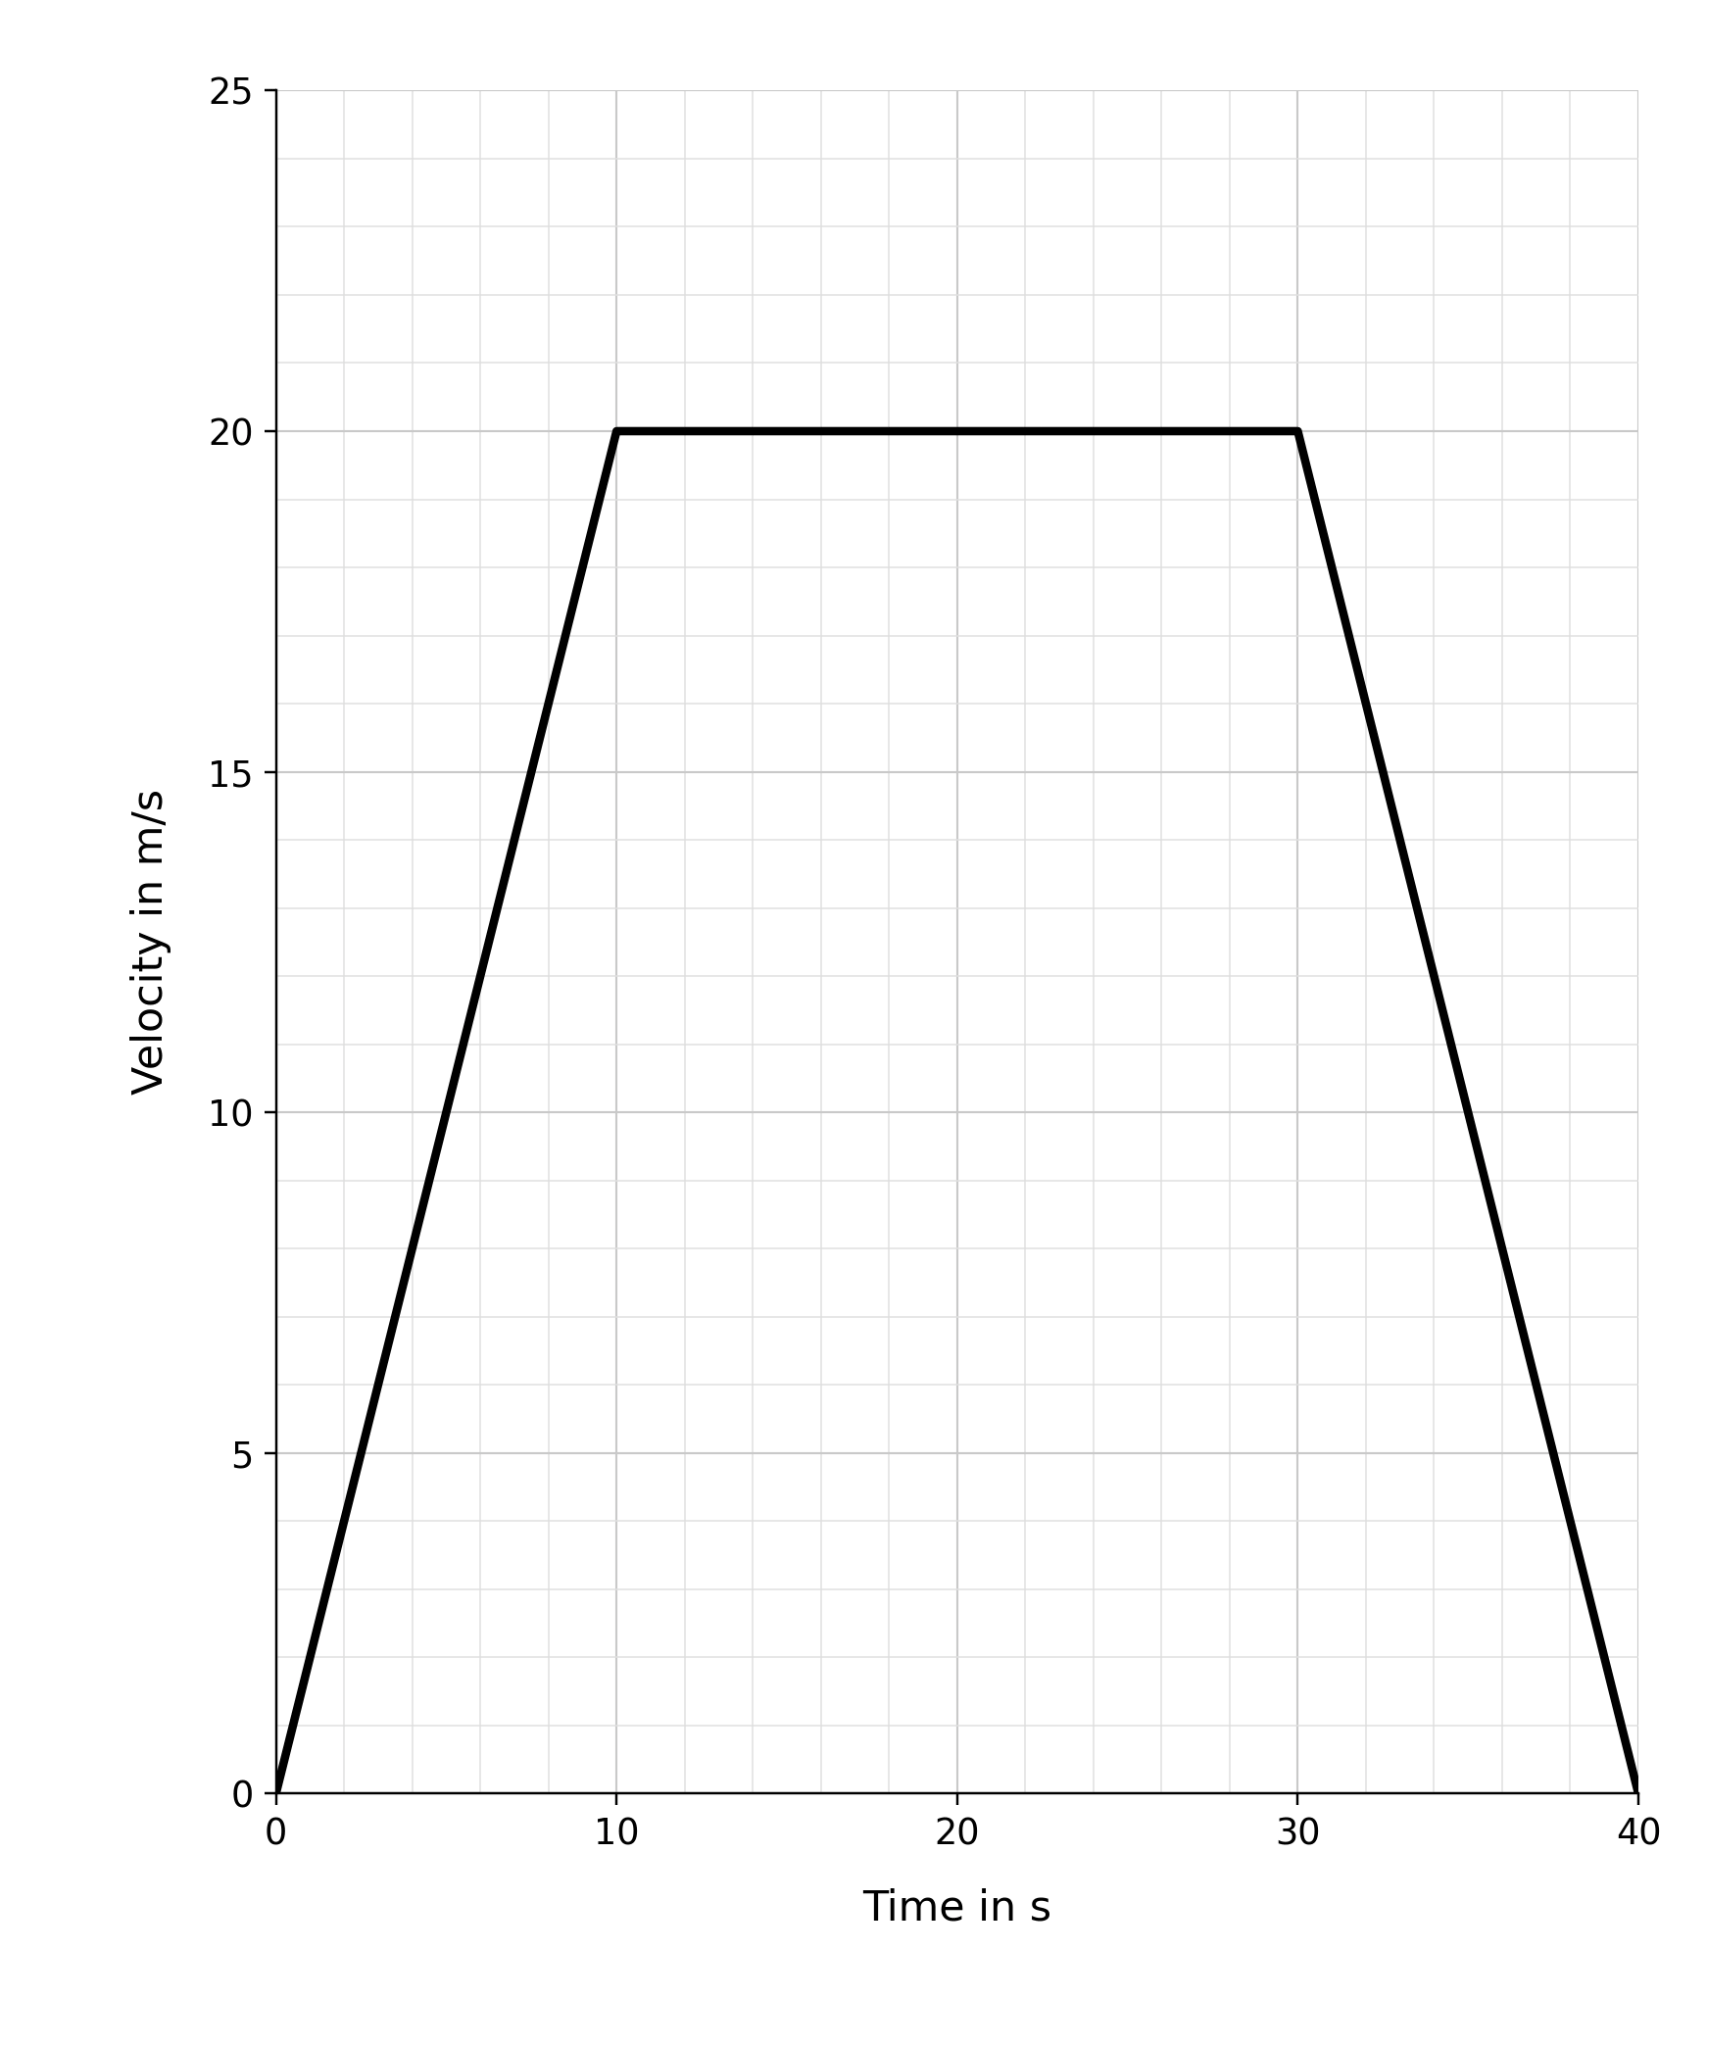
FThe Figure shows the velocity-time graph for a car travelling along a straight road.
Figure
a.[1]
Write down the maximum velocity of the car.
b.[1]
Describe the motion of the car between 10 s and 30 s.
c.[3]
Use the equation: acceleration=change in velocitytime\text{acceleration} = \dfrac{\text{change in velocity}}{\text{time}}acceleration=timechange in velocity
Calculate the acceleration of the car in the first 10 s. Give the unit.
d.[2]
A student says:
'The car is not moving between 10 s and 30 s because the line on the graph is flat.'
Explain why the student is wrong.
2.1 Motion Questions
43 exam-style questions on OCR GCSE Physics 2.1 Motion, covering 2.1.1 Measuring distance and time, 2.1.2 Measuring speed, 2.1.3 Ratios, units and rates in motion, 2.1.4 Scalars and vectors in motion, 2.1.5 Distance-time and velocity-time graphs, 2.1.6 Area under a velocity-time graph, 2.1.7 Average speed for non-uniform motion, and 2.1.8 Uniform motion and uniform acceleration. Each one has a worked solution and a mark scheme showing where the marks go.