An engineer investigates the motion of a vertical-takeoff test drone flying horizontally along a straight path.
Look at the distance-time graph for the drone during its 120-second test flight.
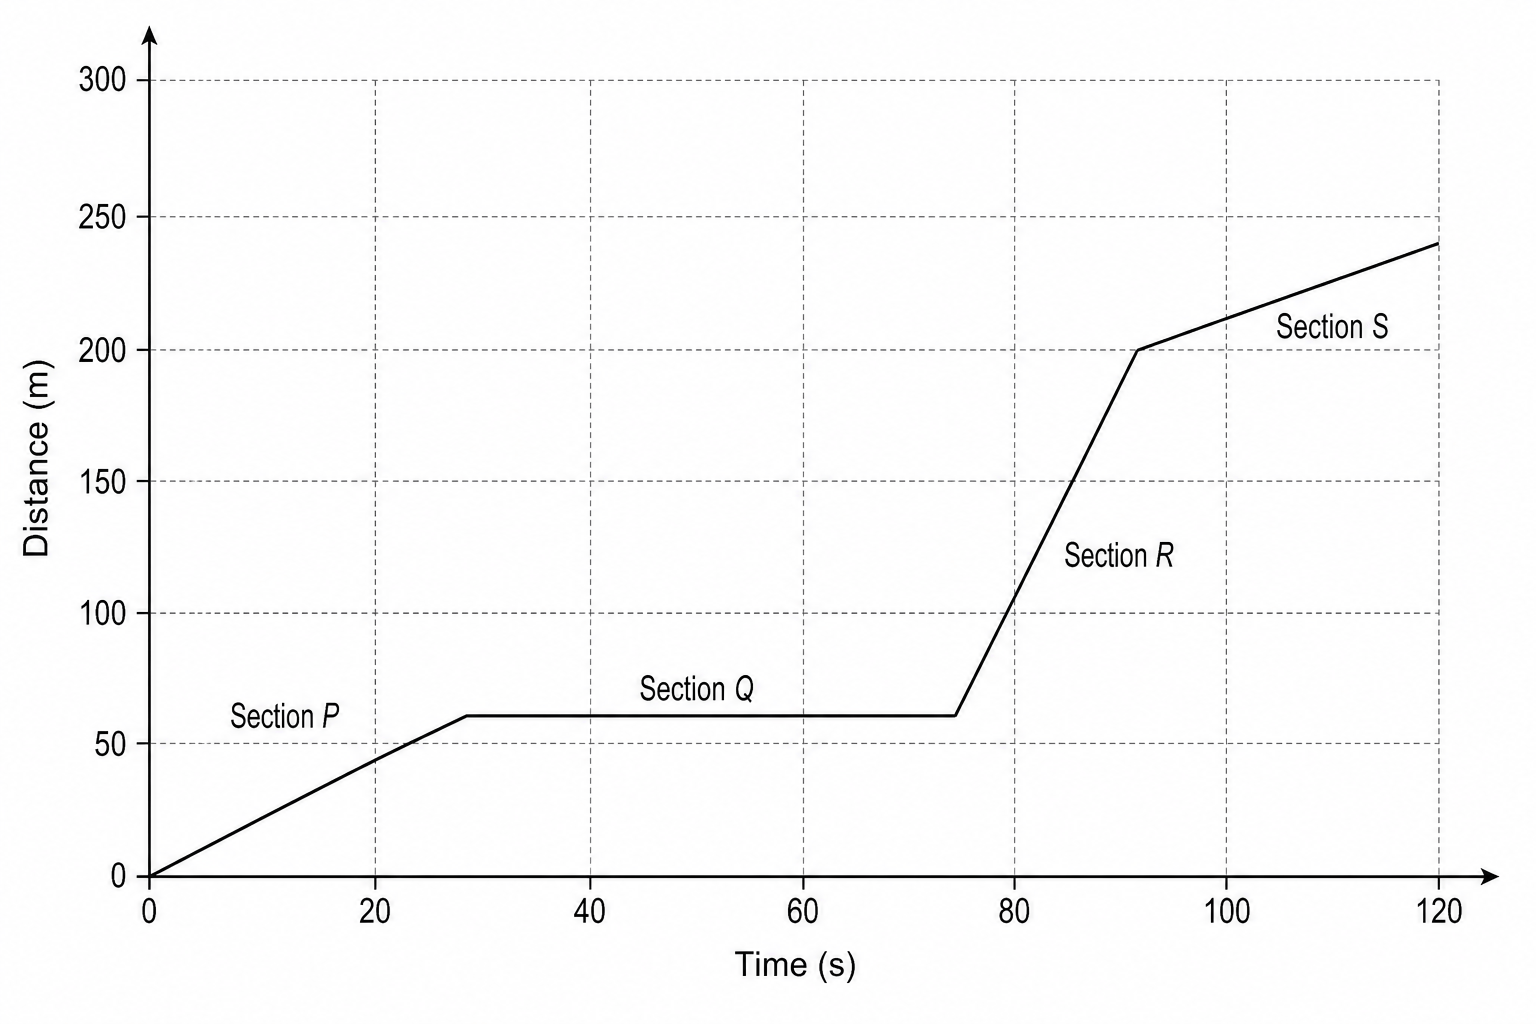
(i) How far did the drone travel?
Distance = ........................... m
(ii) How long did the drone's test flight last?
Time = ........................... s
(iii) Name a piece of apparatus the engineer could use to accurately measure a straight line distance of up to 300 m on the ground.
The distance-time graph has four sections: P, Q, R, and S.
(i) Which section of the graph shows the greatest speed?
Select one (P, Q, R, or S) and explain your answer.
(ii) Which section of the graph shows zero speed?
Select one (P, Q, R, or S) and explain your answer.
The engineer draws a velocity-time graph for a toy train accelerating along a straight track.
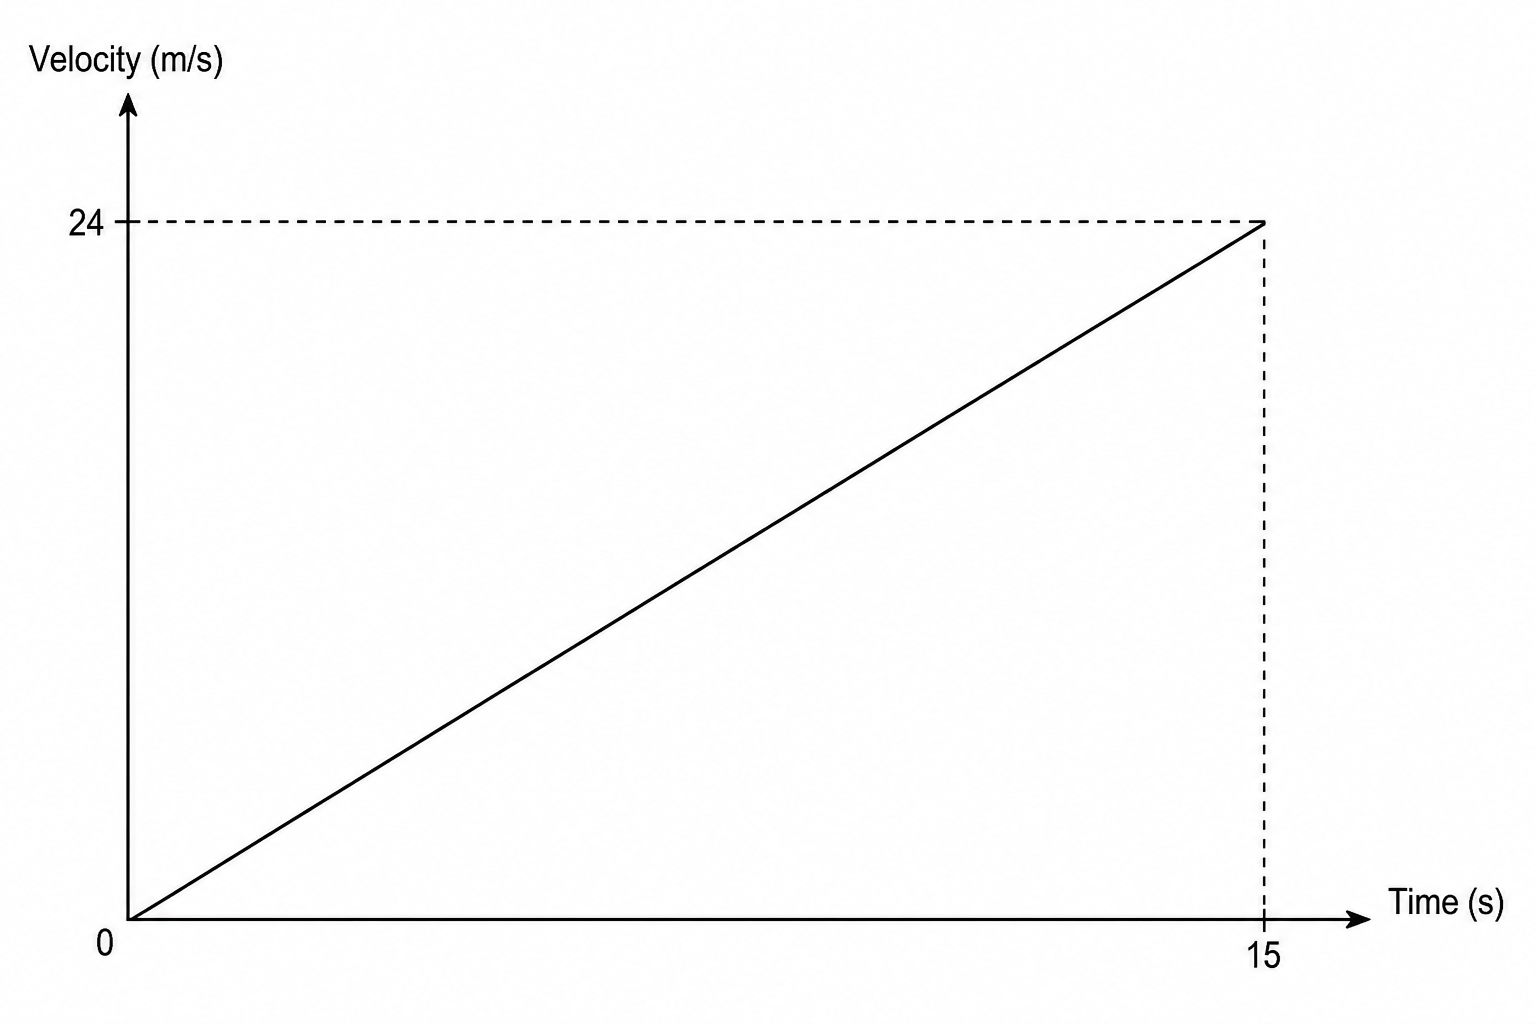
Acceleration is the gradient of a velocity-time graph.
Calculate the acceleration of the toy train.
Use the equation:
acceleration=change in velocity÷time\text{acceleration} = \text{change in velocity} \div \text{time}acceleration=change in velocity÷time
Acceleration = ........................... m/s2\text{m/s}^2m/s2