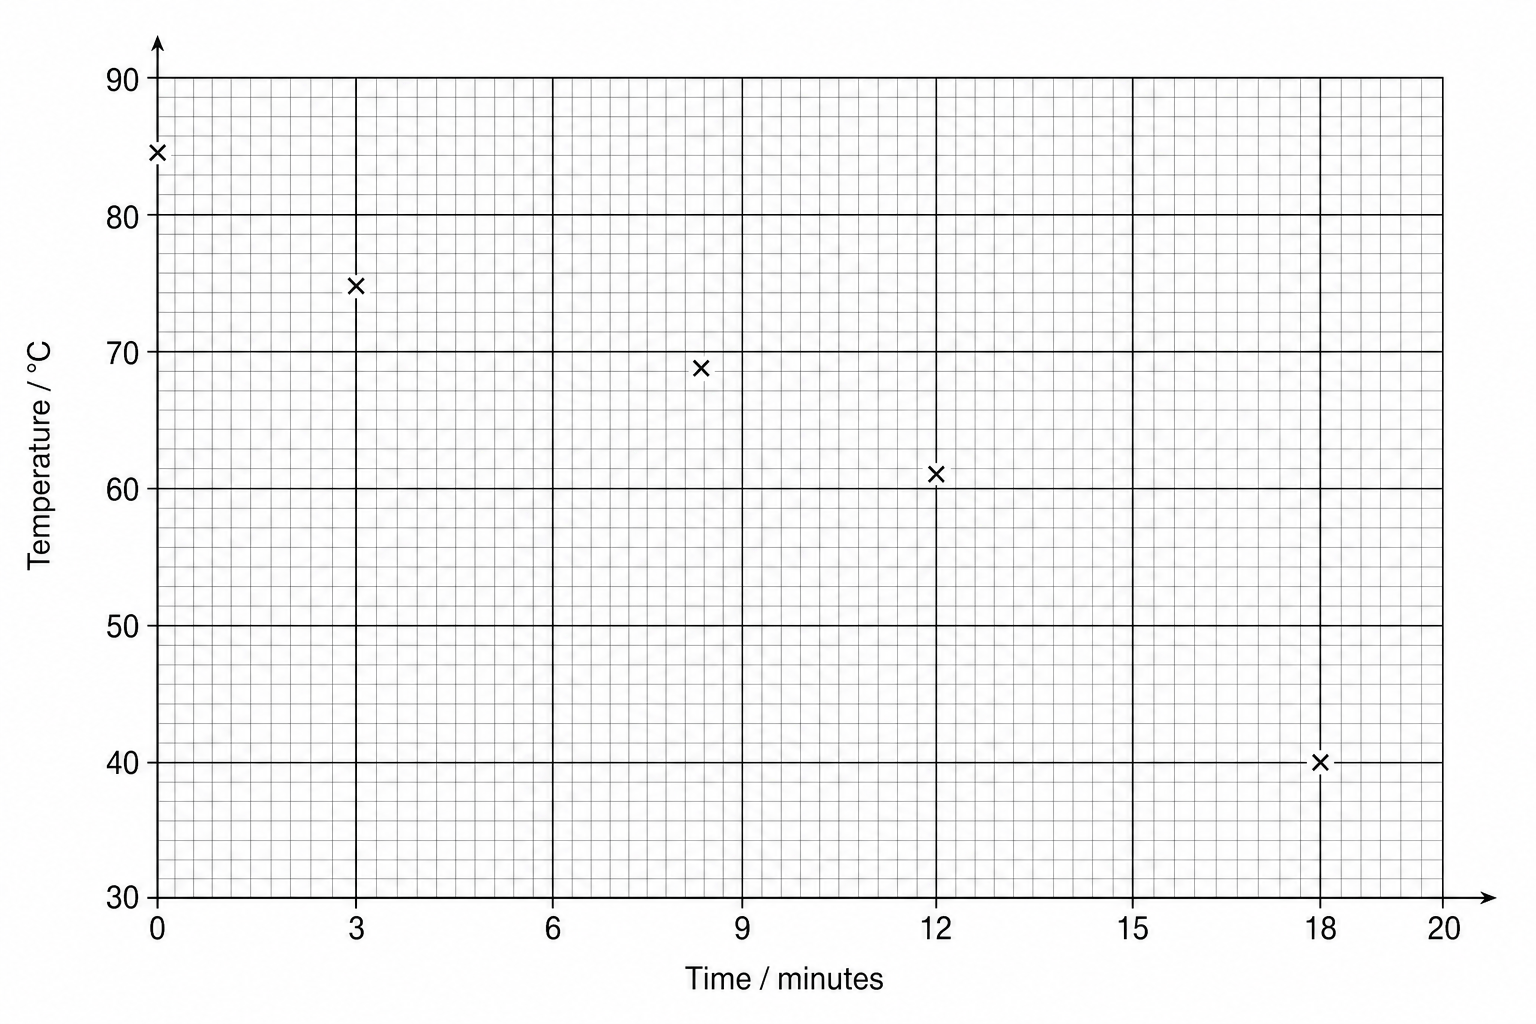
A student investigates the cooling curve of a sample of stearic acid as it cools and changes state from a liquid to a solid.
The temperature of the stearic acid is recorded every 3 minutes.
Table 1 shows the results.
Table 1
| Time in minutes | Temperature in ∘C^\circ\text{C}∘C |
|---|---|
| 0 | 85 |
| 3 | 75 |
| 6 (not yet plotted) | 69 |
| 9 | 69 |
| 12 | 61 |
| 15 (not yet plotted) | 51 |
| 18 | 40 |
Plot these two remaining points on the graph shown in Figure 1.
Figure 1