Gas pressure and temperature

EasyMediumHard
12345678910111213141516171819202122232425262728
Question 24
Medium

A student investigates the relationship between the pressure and volume of a fixed mass of gas at a constant room temperature. Their results are plotted on the graph below.
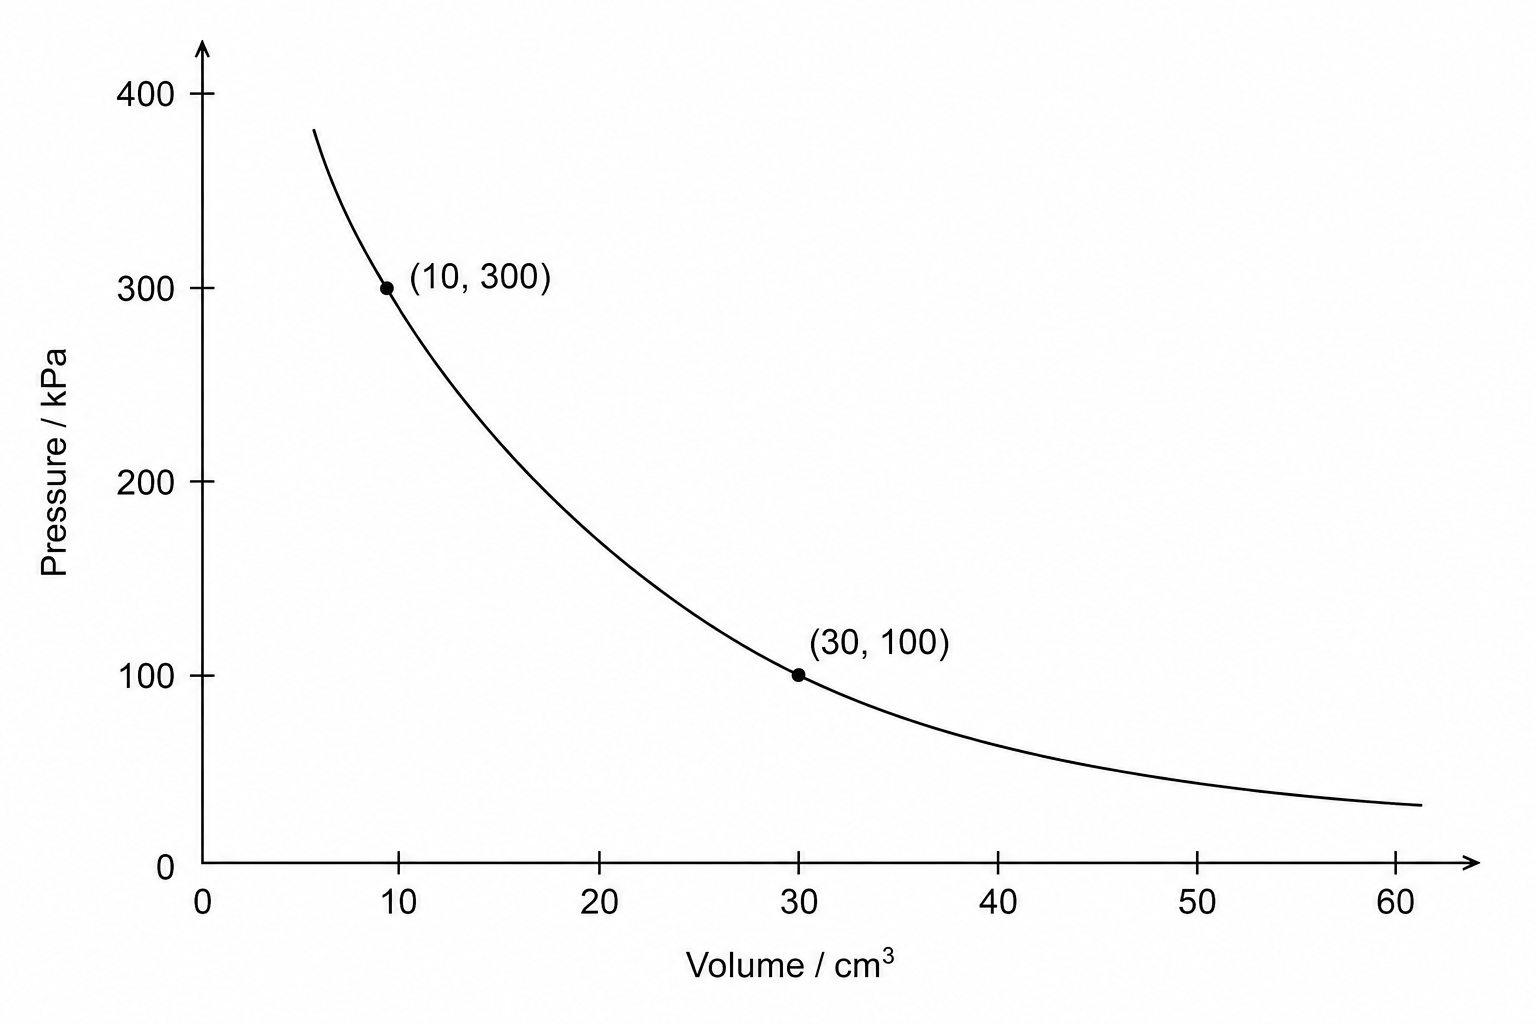
A line graph with pressure in kilopascals, kPa, on the y-axis ranging from 0 to 400, and volume in cubic centimetres, cm³, on the x-axis ranging from 0 to 60. A smooth, downward-sloping curve shows that as volume increases, pressure decreases in an inversely proportional relationship. Points on the curve include (10, 300) and (30, 100).

Describe how the curve on the graph would change if the student repeated the experiment with the same mass of gas, but at a lower constant temperature.

[2]

Gas pressure and temperature Questions

  1. GCSE
  2. /Physics
  3. /Gas pressure and temperature