Figure 3 shows the sources of electricity generation for a regional power grid in 2023. Figure 3 is to scale.
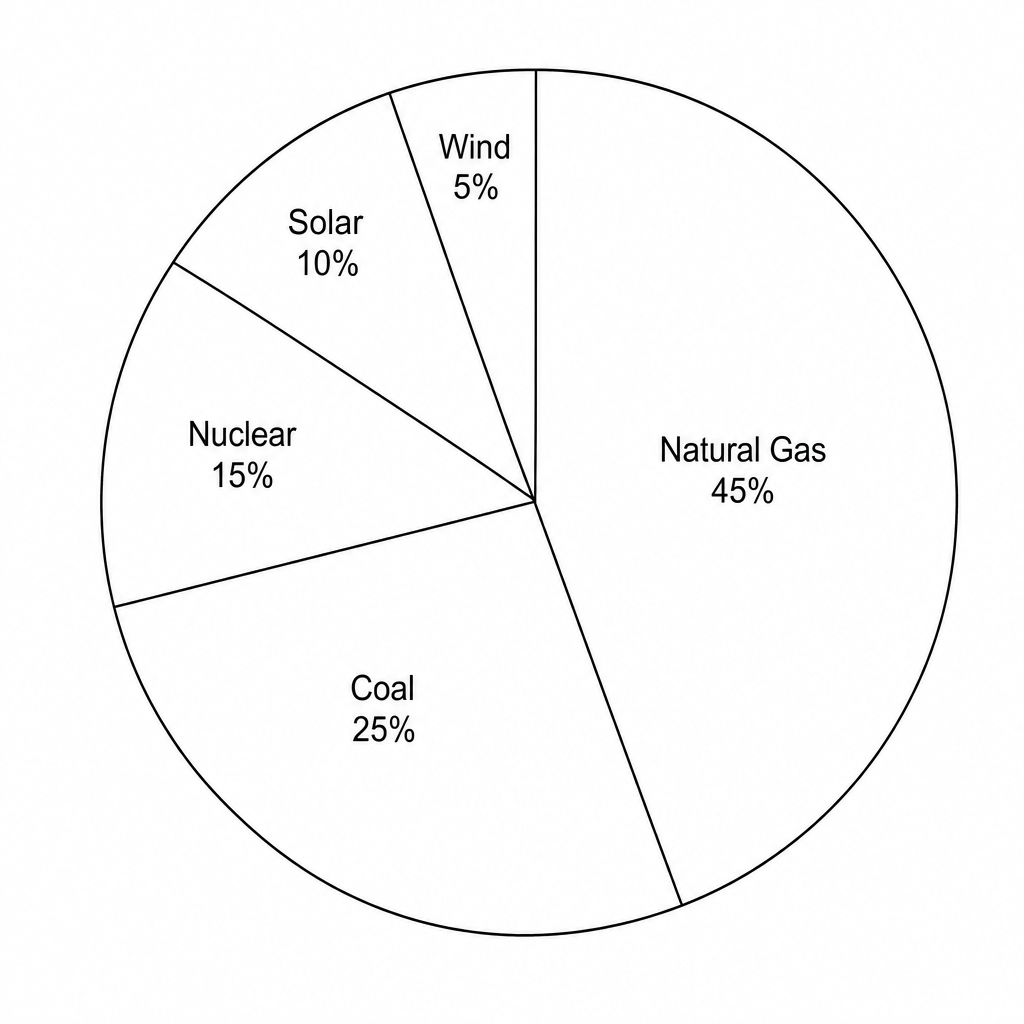
| Electricity Generation Source | Approximate Percentage (%) |
|---|---|
| Natural Gas | 45 |
| Coal | 25 |
| Nuclear | 15 |
| Solar | 10 |
| Wind | 5 |
State the electricity source that provided the greatest amount of electricity for this grid in 2023.