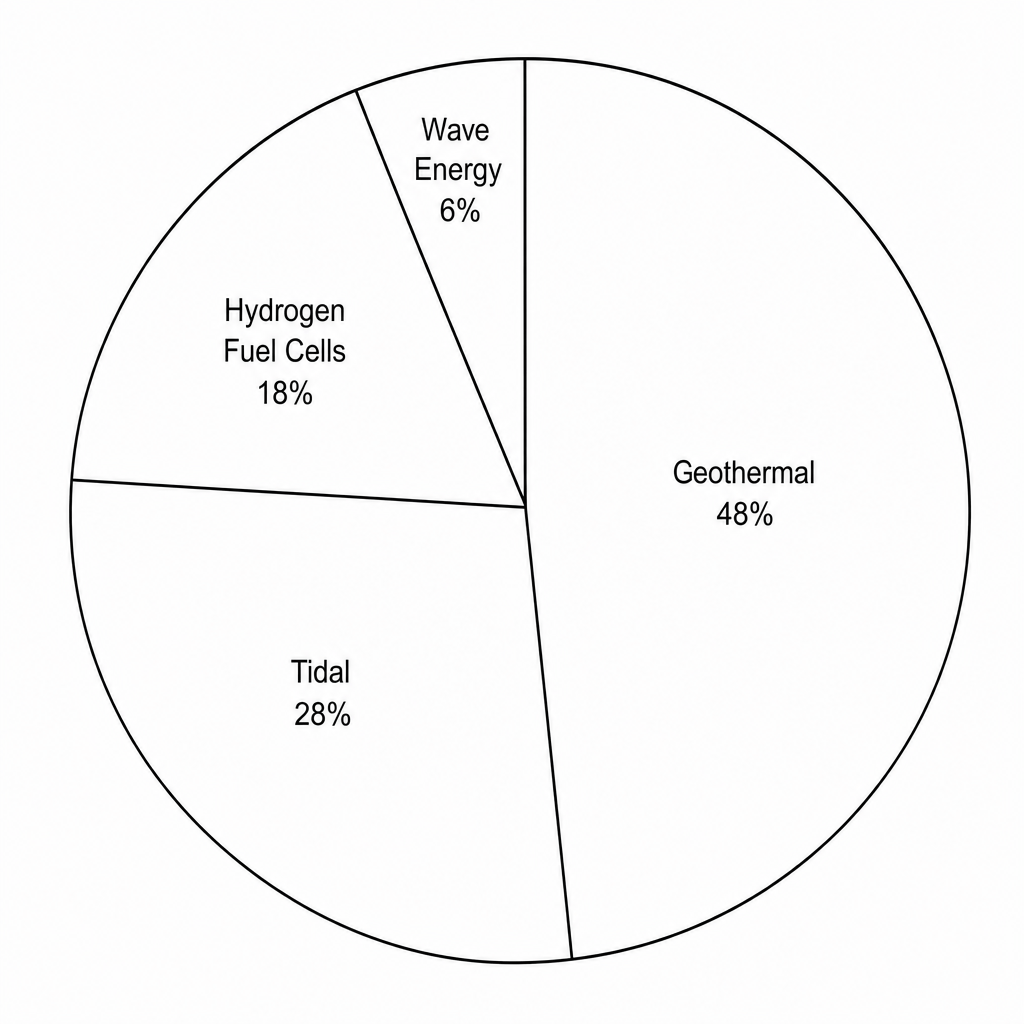
An eco-industrial park tracked the contributions of its clean energy resources to its micro-grid during a test period in 2025. The data is presented in the table and represented in the chart below.
| Energy Resource | Percentage of Contribution (%) |
|---|---|
| Geothermal | 48 |
| Tidal | 28 |
| Hydrogen Fuel Cells | 18 |
| Wave Energy | 6 |
An engineer identifies geothermal as the primary energy resource for this park's micro-grid.
Justify this choice using the data.