Efficiency and energy resources

EasyMedium
12345678910111213141516171819
Question 14
Medium

In a European nation, electricity is generated using both fossil fuels (non-renewable) and renewable energy resources.

The graph in Figure 1 shows the amount of electricity generated by these two types of resources from 2014 to 2022.
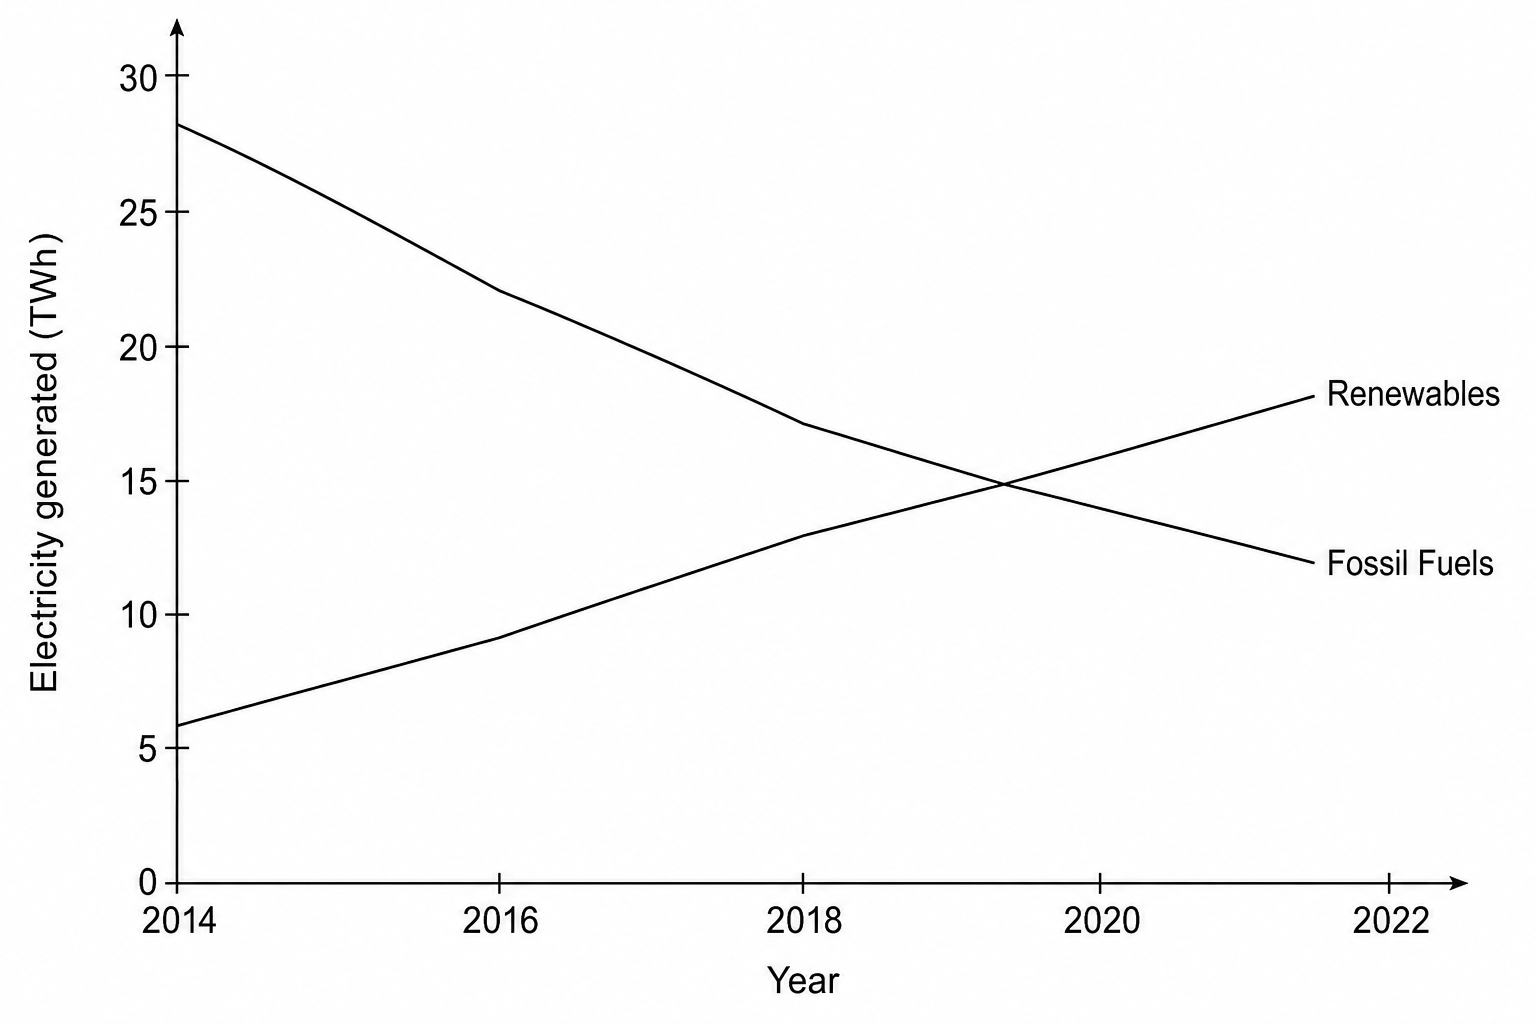
Line graph showing electricity generated in Terawatt-hours (TWh) in a country from 2014 to 2022. The x-axis represents the years from 2014 to 2022. The y-axis represents electricity generated in TWh, with scale marks from 0 to 30. Line A (Fossil Fuels) starts at 28 TWh in 2014, steadily declines to 22 TWh in 2016, 17 TWh in 2018, and drops to 12 TWh in 2022. Line B (Renewables) starts at 6 TWh in 2014, increases steadily to 9 TWh in 2016, 13 TWh in 2018, and rises to 18 TWh in 2022. The two curves cross each other at approximately 15 TWh in the year 2019.

Explain how and why the amount of electricity generated by fossil fuels and renewable energy resources changed from 2014 to 2022.

Your answer should include:

  • a description of the trends shown in Figure 1, using data from the graph
  • reasons for the decrease in fossil fuel use
  • reasons for the increase in renewable energy use
[6]

Efficiency and energy resources Questions

  1. GCSE
  2. /Physics
  3. /Efficiency and energy resources