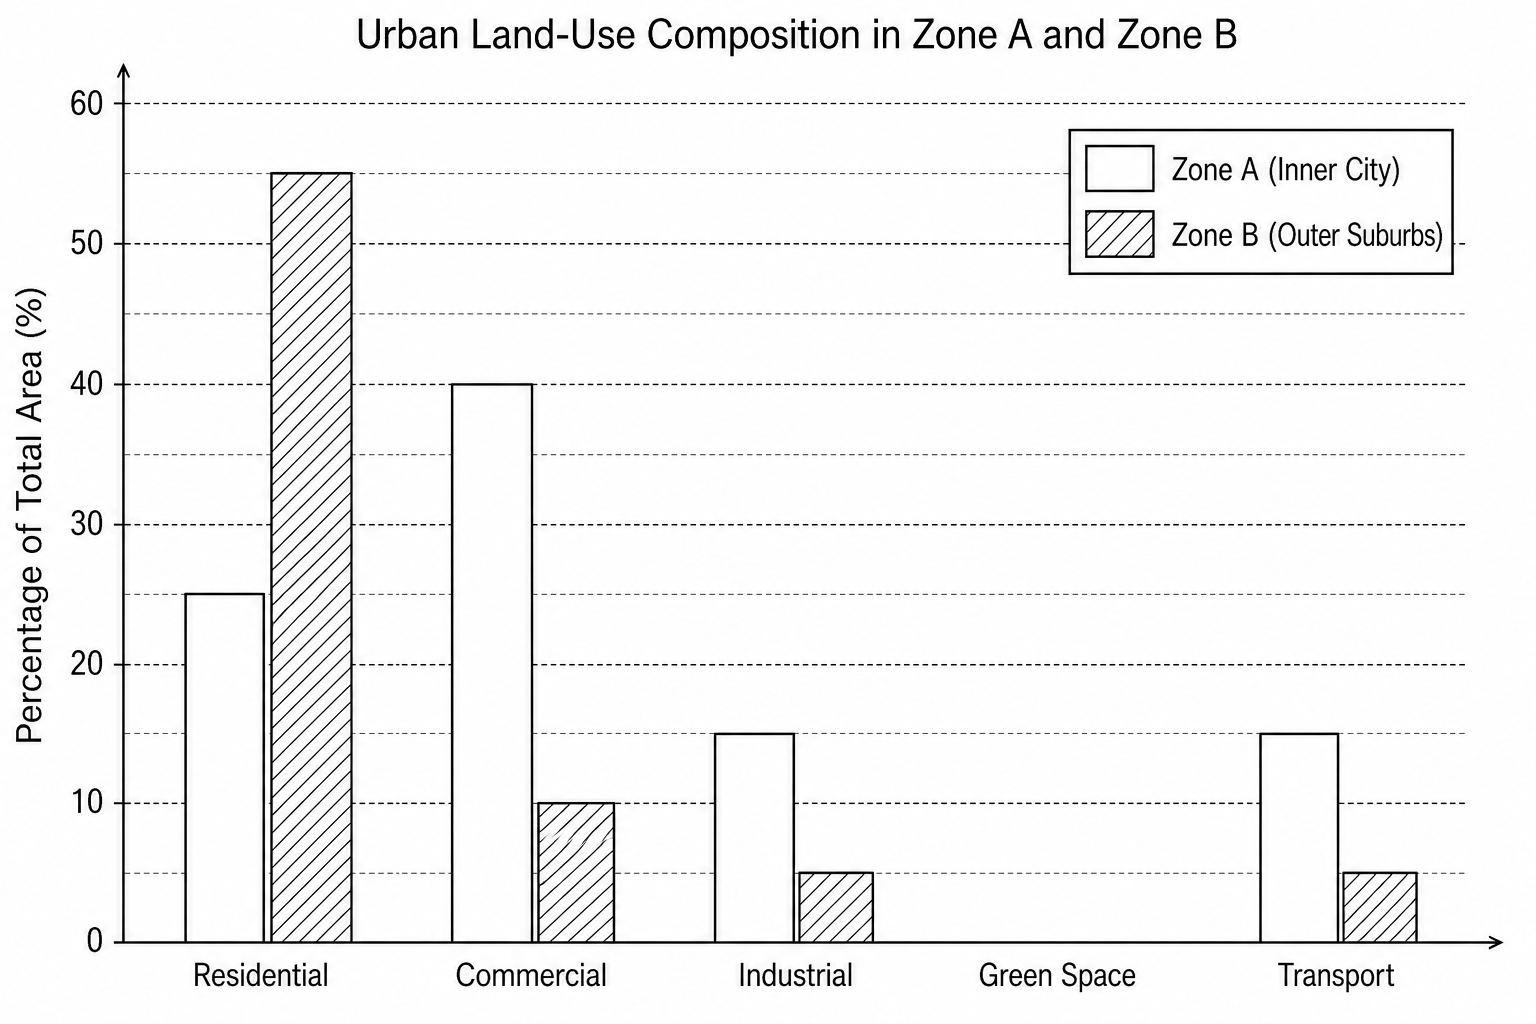
The data in the table below shows the percentage of total land area occupied by different land-use categories sampled across two different urban zones (Zone A in the inner city and Zone B in the outer suburbs).
| Land-use category | Zone A (Inner City) (%) | Zone B (Outer Suburbs) (%) |
|---|---|---|
| Residential | 25 | 55 |
| Commercial | 40 | 10 |
| Industrial | 15 | 5 |
| Green Space | 5 | 25 |
| Transport | 15 | 5 |
Complete the comparative bar chart below by plotting the data for the Green Space category at both Zone A and Zone B.