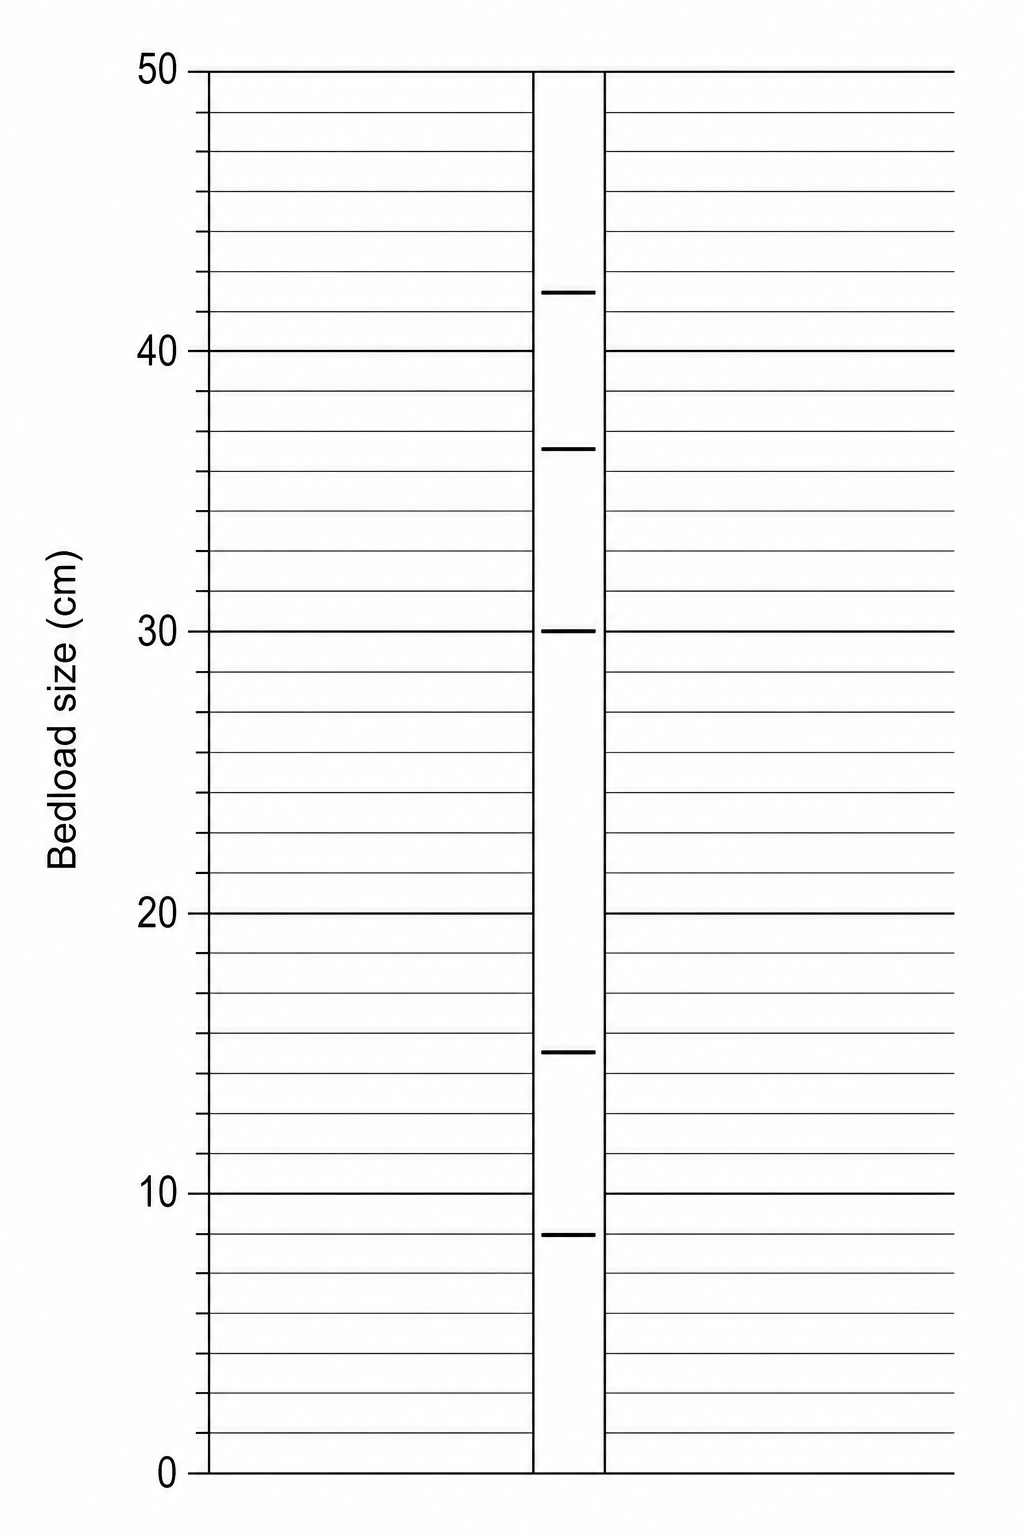
Study Figure 1, which is a dispersion graph showing the size of bedload particles collected at a river site in the UK.
Complete Figure 1 by plotting the following data point:
Draw on this