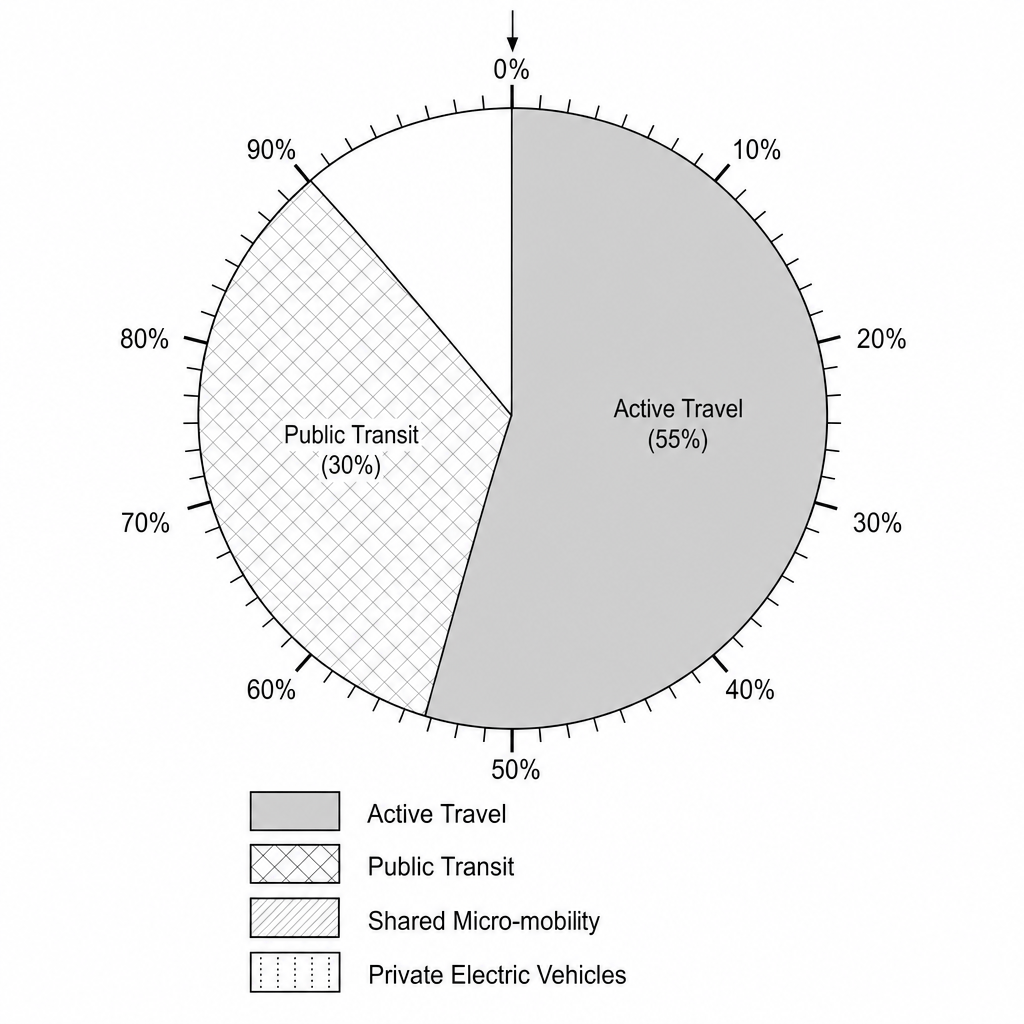
The table below shows the modal split of daily commutes in the eco-city of Eco-Haven for 2023.
Use the data from the table to complete the partially finished pie chart.
| Commute Method | % of total commutes (2023) | Key Shading |
|---|---|---|
| Shared Micro-mobility | 8% | Diagonal stripes |
| Private Electric Vehicles | 4% | Vertical dots |