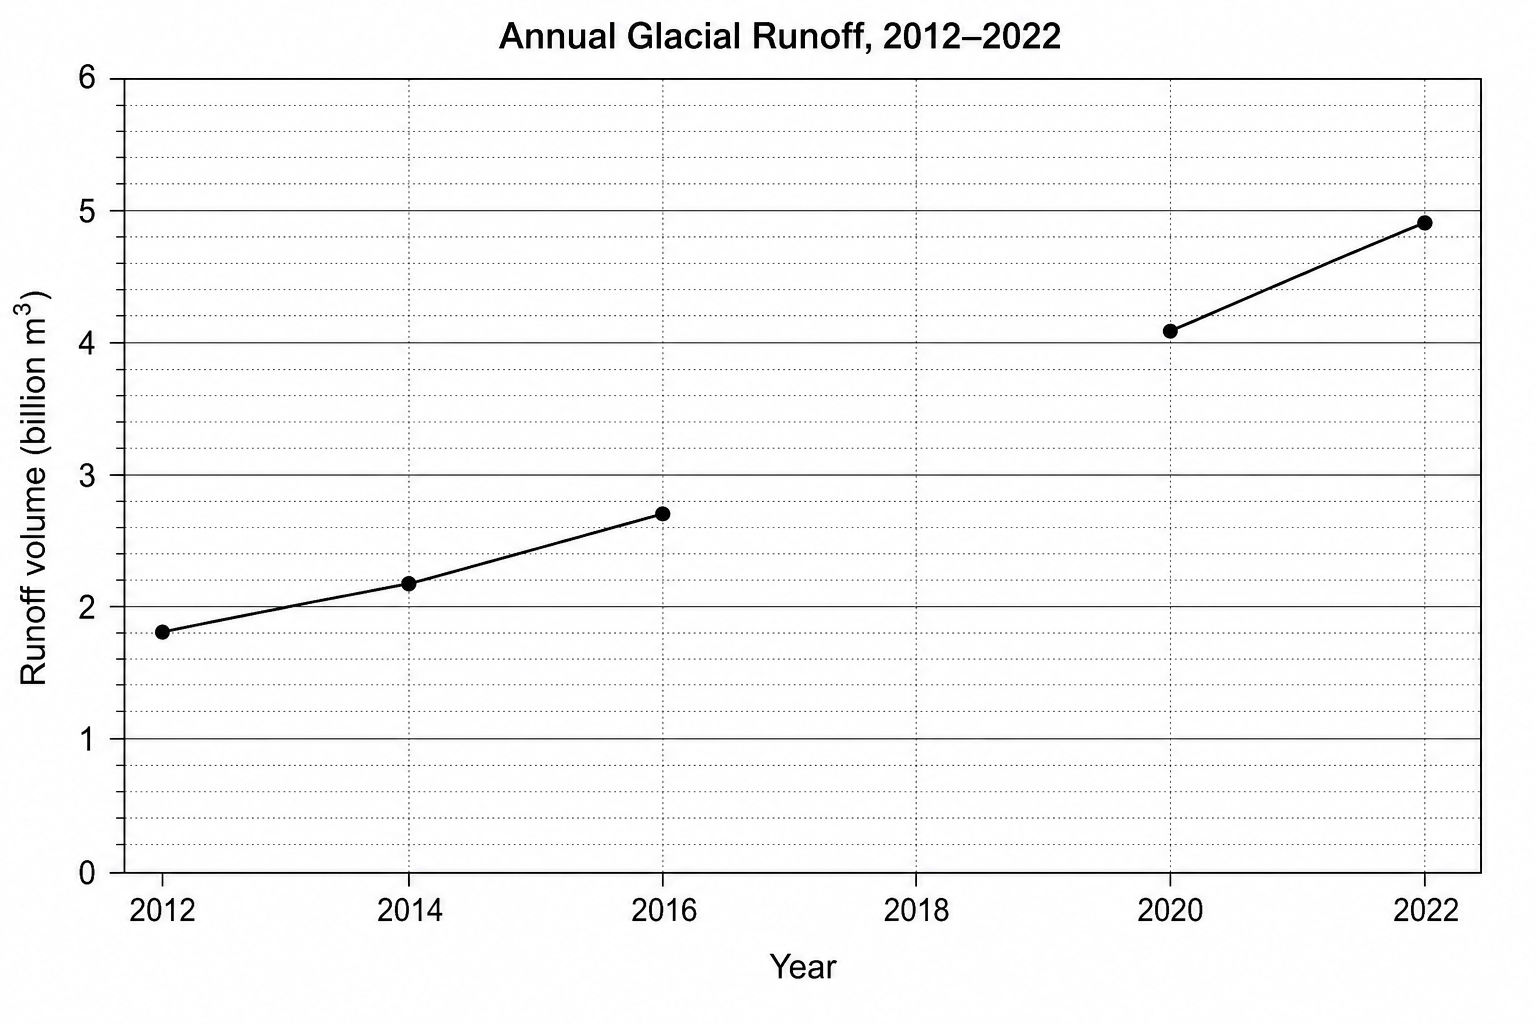
The line graph below shows changes in the annual runoff volume from a glacier basin in Western Canada between 2012 and 2022.
Use the data from the table below to complete the line graph [1].
| Year | Annual glacial runoff (billion m3\text{m}^3m3) |
|---|---|
| 2018 | 3.4 |