Study Figure 1, a scatter graph showing the relationship between Mean Annual Precipitation and Average Net Primary Productivity (NPP) across various terrestrial ecosystems.
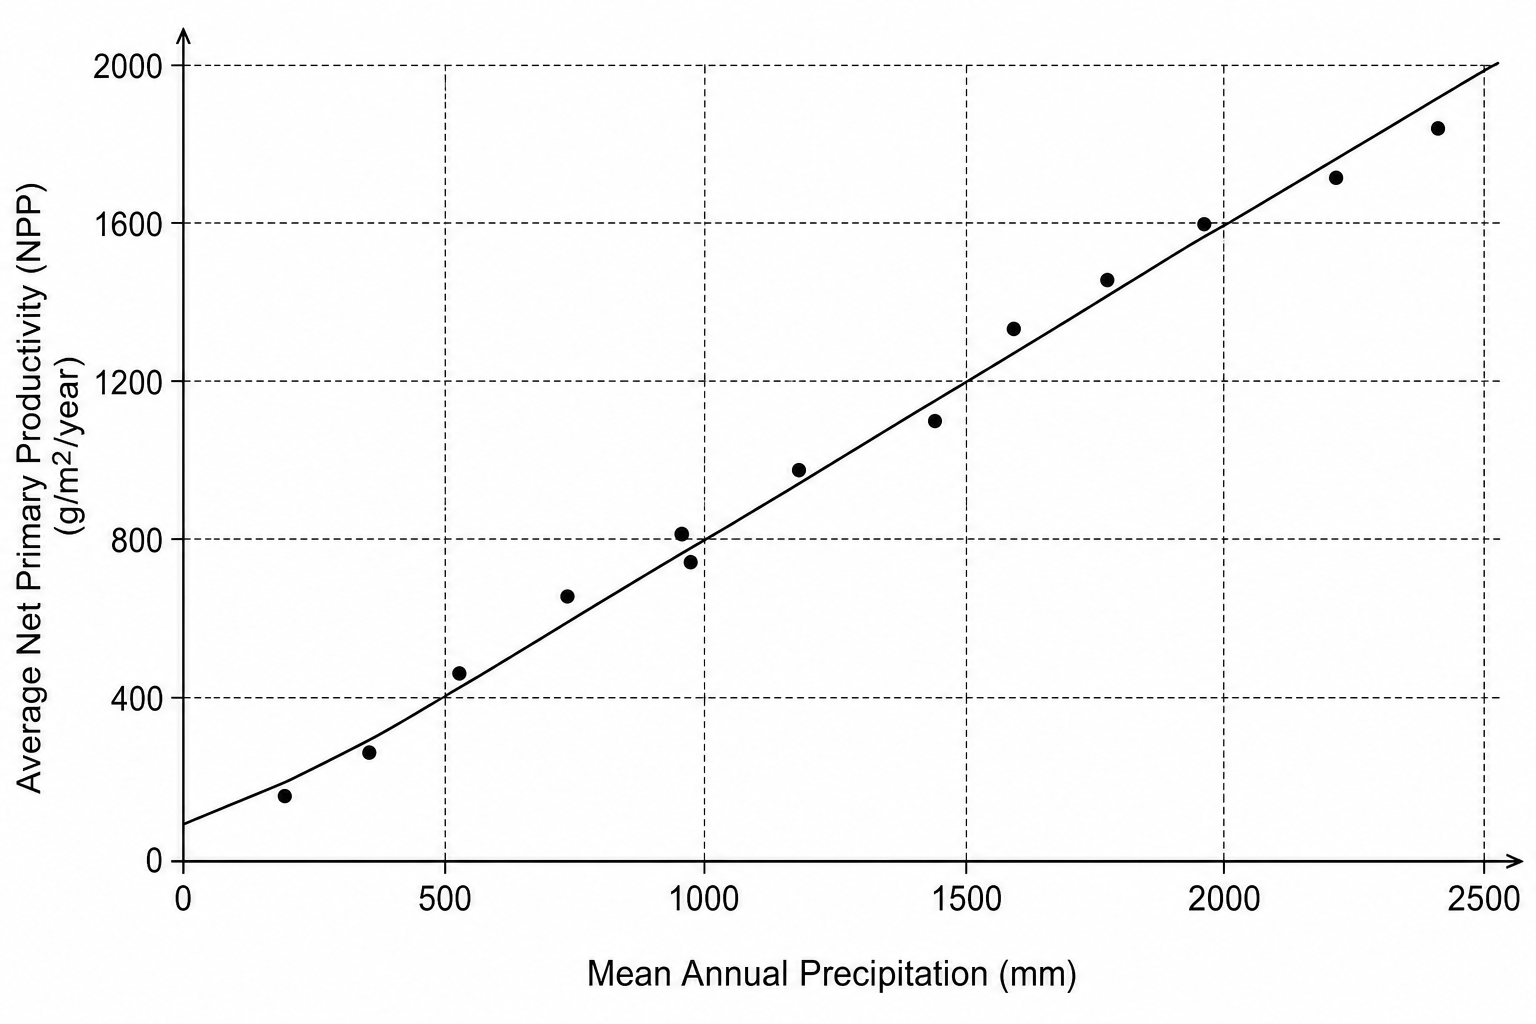
Based on the trend shown in Figure 1, what would be the expected Average Net Primary Productivity (NPP) for an ecosystem with a Mean Annual Precipitation of 1,500 mm1,500\text{ mm}1,500 mm?
800 g/m2/year800\text{ g/m}^2/\text{year}800 g/m2/year
1,200 g/m2/year1,200\text{ g/m}^2/\text{year}1,200 g/m2/year
1,600 g/m2/year1,600\text{ g/m}^2/\text{year}1,600 g/m2/year
1,800 g/m2/year1,800\text{ g/m}^2/\text{year}1,800 g/m2/year