Question 31
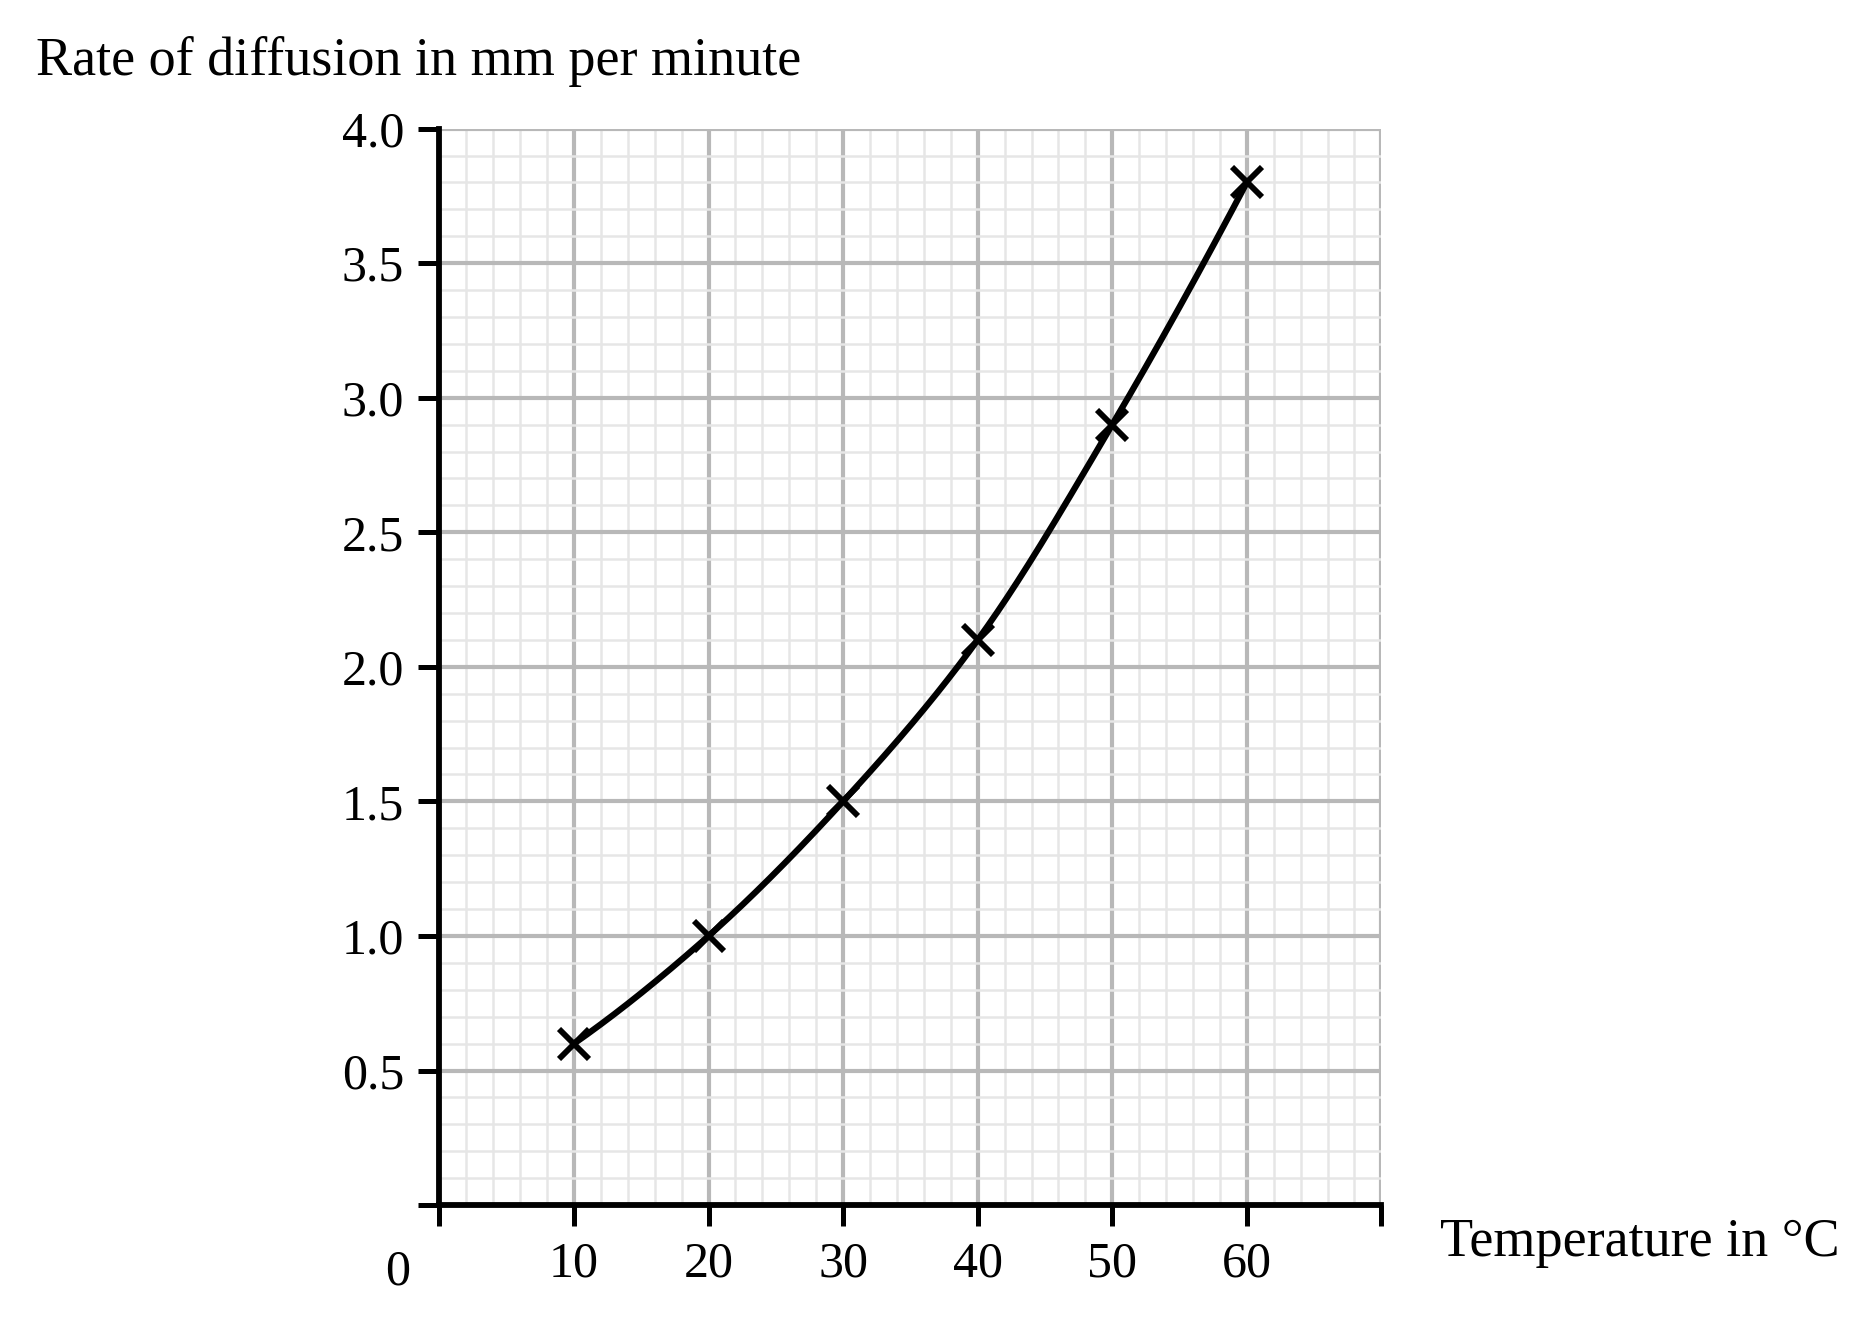
FA student investigated the effect of temperature on the rate at which a coloured dye diffused through water. The graph shows the student's results.
Figure: The rate of diffusion of a coloured dye through water at temperatures between 10 °C and 60 °C
a.[2]
Describe the relationship shown in the graph. Use data from the graph in your answer.
b.[2]
Explain why an increase in temperature increases the rate of diffusion.
c.[1]
Use the graph to estimate the rate of diffusion of the dye at 35 °C.
d.[1]
Give one variable the student should have kept the same in this investigation.
1.3 Transport in cells Questions
58 exam-style questions on AQA GCSE Biology 1.3 Transport in cells, covering 1.3.1 Diffusion, 1.3.2 Osmosis, and 1.3.3 Active transport. Each one has a worked solution and a mark scheme showing where the marks go.