Question 10
FA student investigated how the concentration of oxygen around plant tissue affects the uptake of potassium ions.
The student cut discs of plant tissue and put equal masses of the discs into five flasks. Each flask held the same volume of a dilute potassium chloride solution, but a different concentration of oxygen. After 3 hours the student measured the mass of potassium ions taken up by the discs.
The table shows the student's results.
Table: The mass of potassium ions taken up by discs of plant tissue after 3 hours at five different oxygen concentrations
| Oxygen concentration in % | Mass of potassium ions taken up in μg\mu\text{g}μg |
|---|---|
| 0 | 4 |
| 5 | 22 |
| 10 | 38 |
| 15 | 47 |
| 21 | 50 |
a.[1]
Give the independent variable in this investigation.
b.[2]
Give two variables the student controlled.
c.[2]
Calculate the mean rate of potassium ion uptake at an oxygen concentration of 10%.
Give your answer in μg\mu\text{g}μg per hour.
d.[3]
Figure: Grid for plotting the results shown in the table
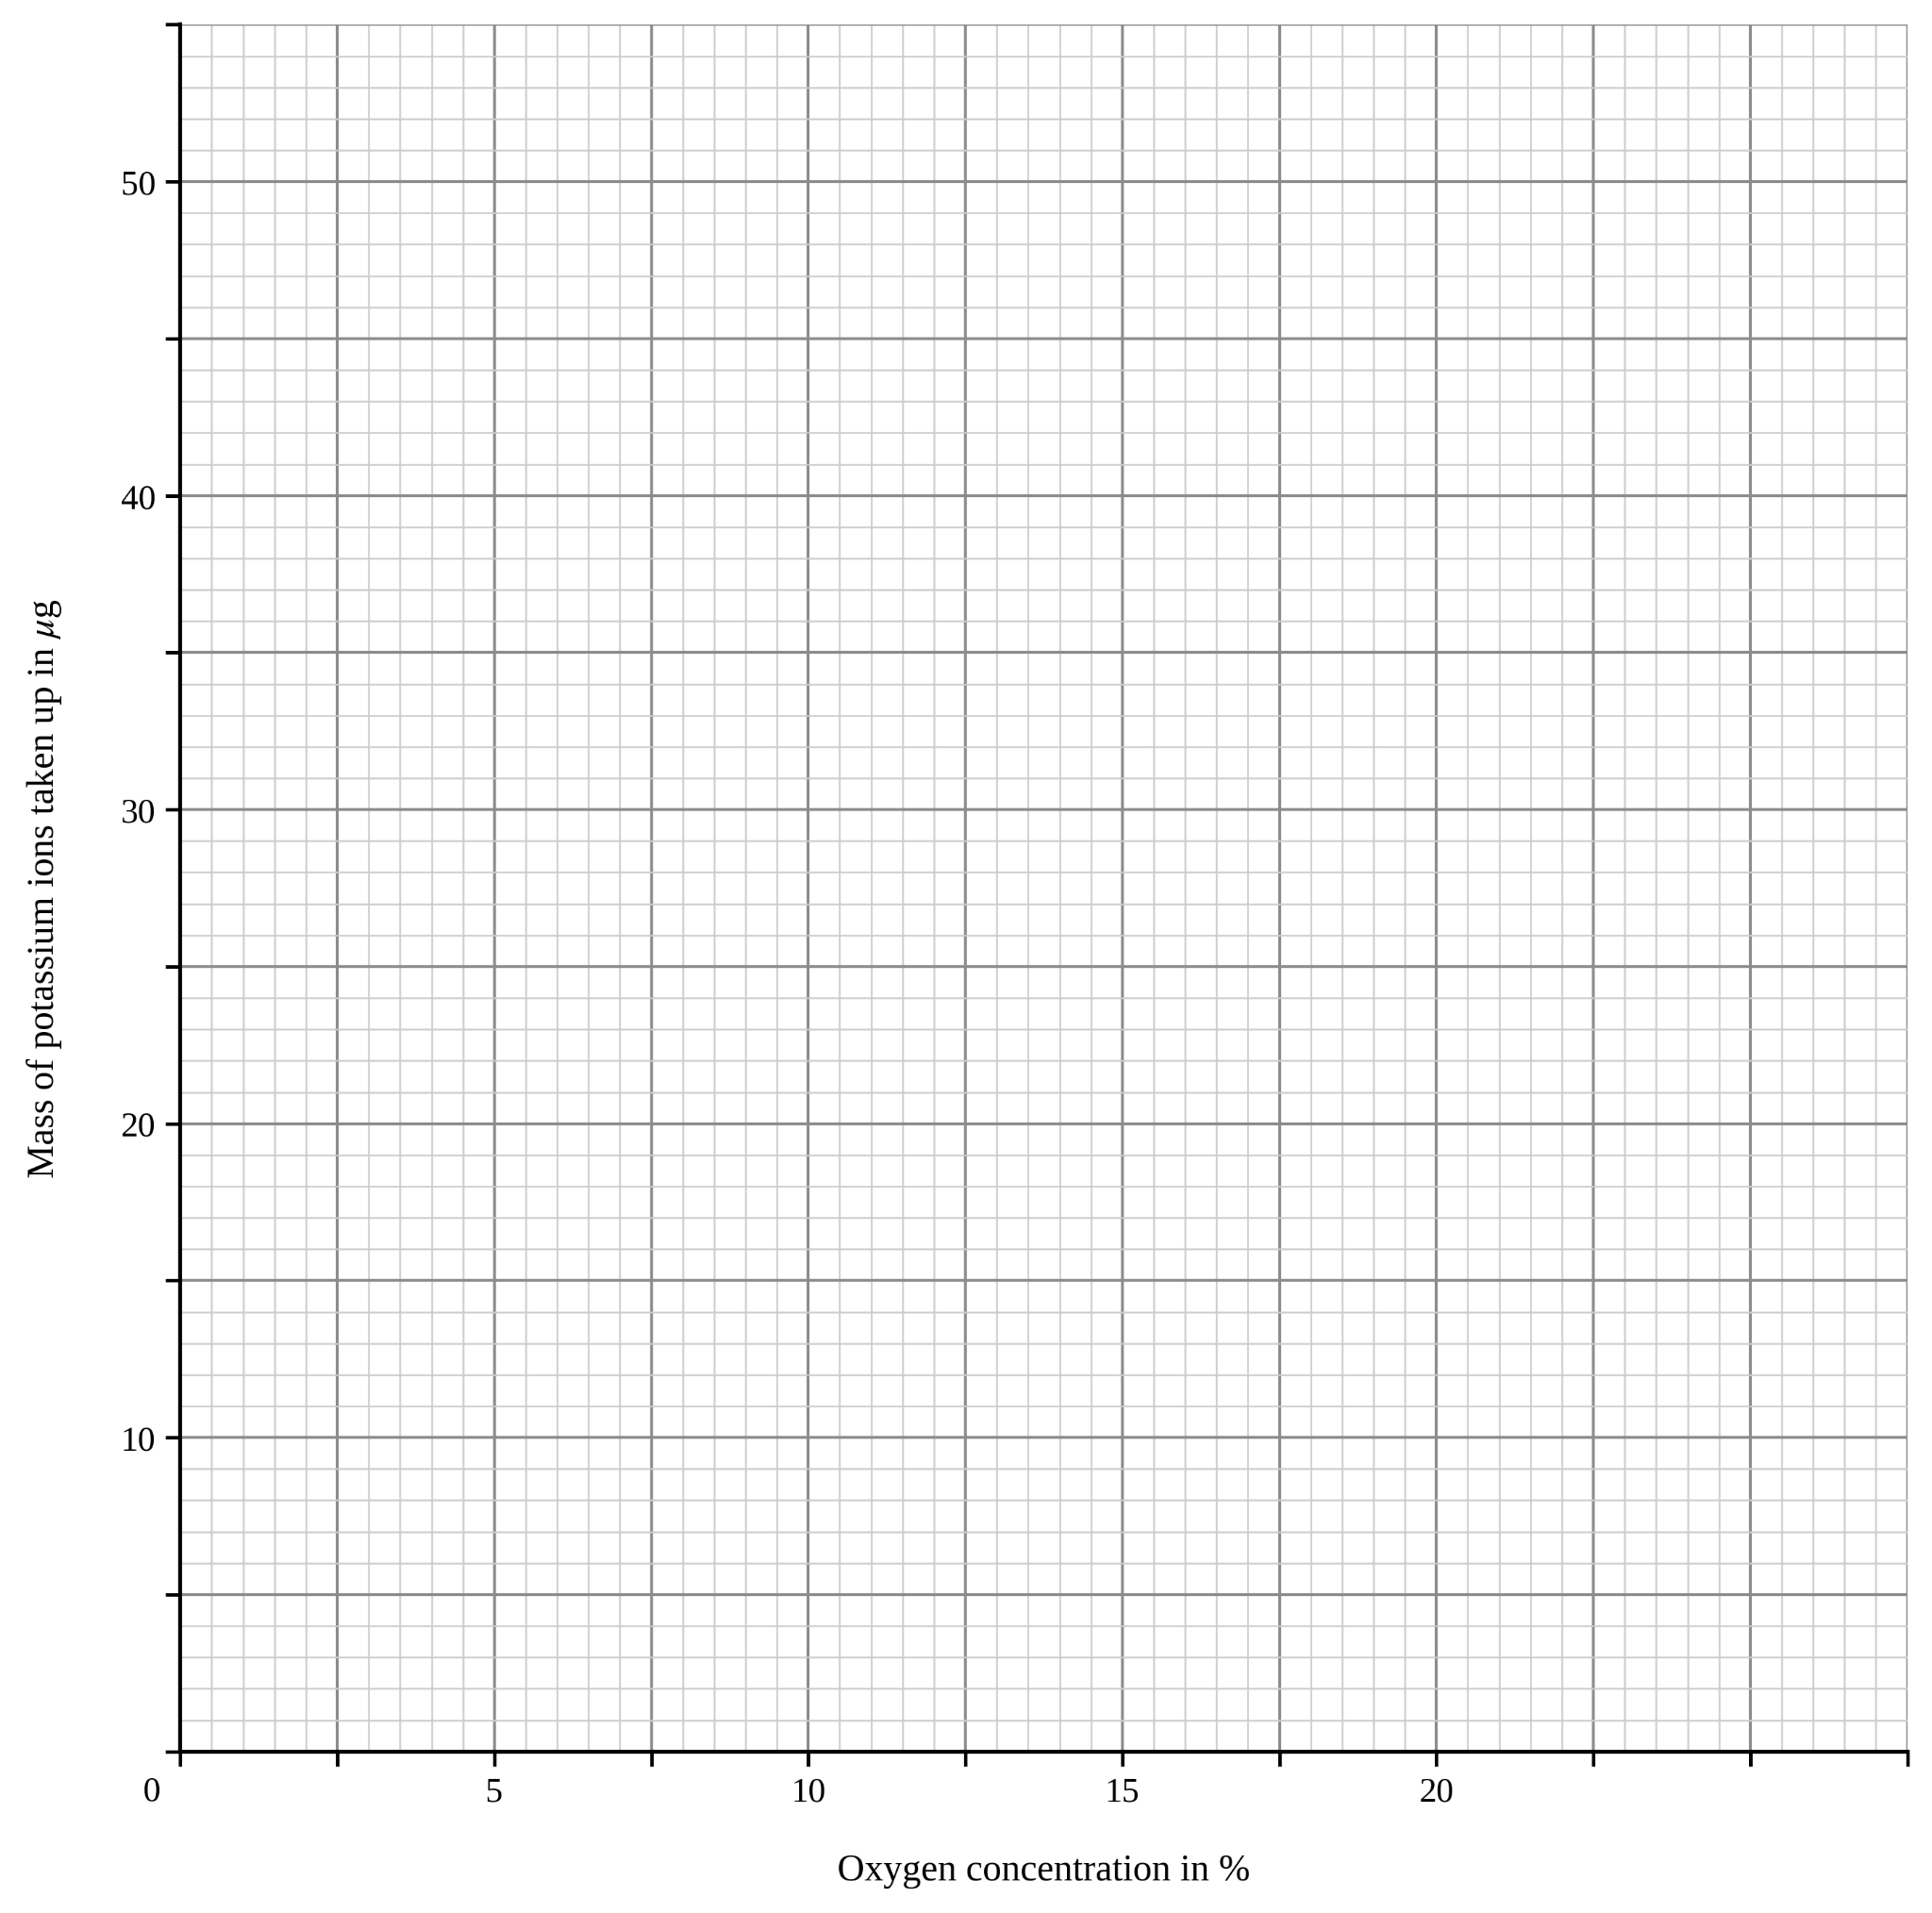
Plot the results from the table on the grid in the figure.
Draw a curve of best fit.
e.[3]
Explain the shape of the curve between 0% and 21% oxygen.
f.[2]
Some potassium ions were still taken up when the oxygen concentration was 0%.
Suggest an explanation for this.
1.3 Transport in cells Questions
58 exam-style questions on AQA GCSE Biology 1.3 Transport in cells, covering 1.3.1 Diffusion, 1.3.2 Osmosis, and 1.3.3 Active transport. Each one has a worked solution and a mark scheme showing where the marks go.