GCSE English Results: State vs Private Schools
GCSE English Language and Literature state vs private results explained: what official data shows, its limits, and what students should do next.
A school average can feel strangely personal. If one type of school records more top grades than another, it is easy to read the table as a prediction about your own future. It is not. The latest GCSE English Language and Literature state vs private results indicate that independent schools generally record a higher proportion of top grades, but raw results do not reveal how much of that difference is caused by teaching, admissions, pupil circumstances, subject entry choices or qualifications taken outside the GCSE datasets.
That is the useful answer upfront: the gap is real at an aggregate level, but it cannot tell an individual student what grade they will achieve. Your next revision decision is far more actionable than your school category.
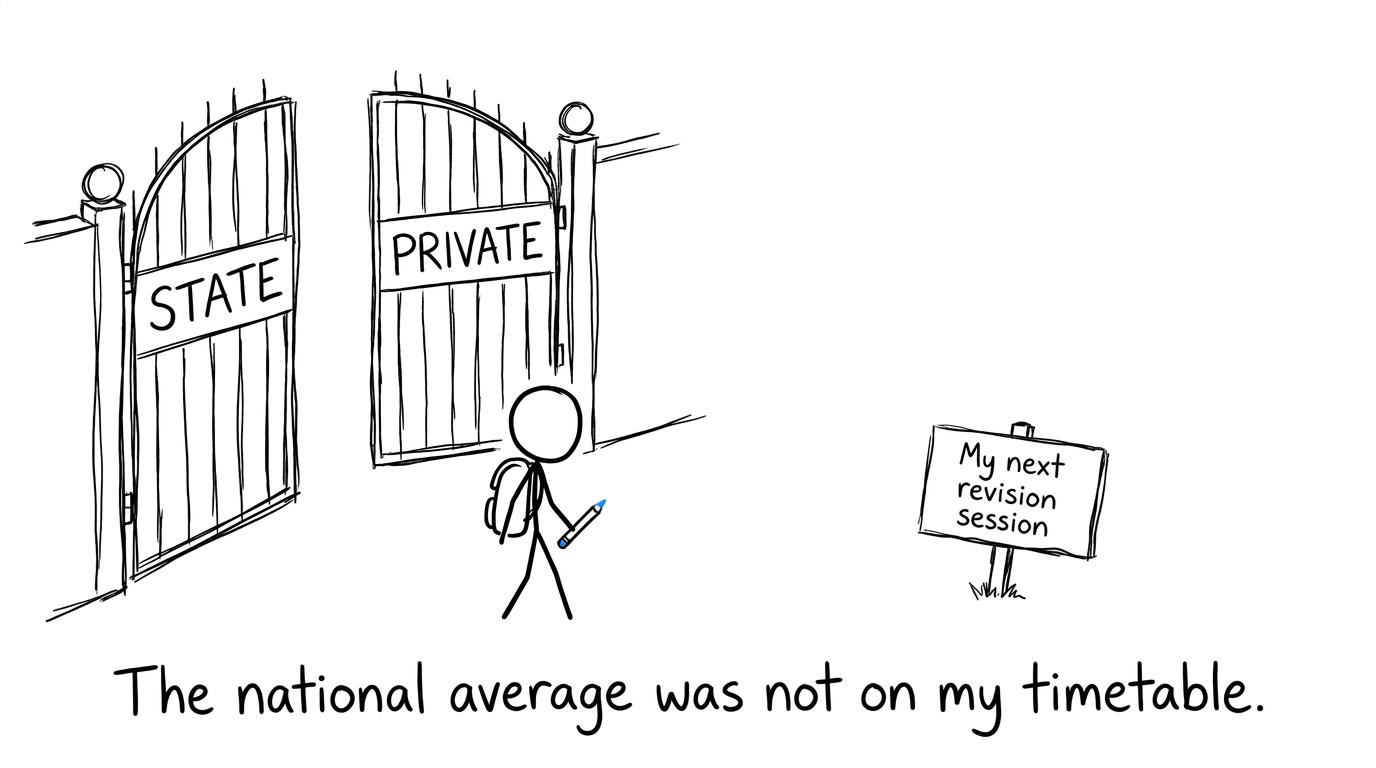 A student chooses revision over worrying about national averages
What to check before comparing the results
A reliable comparison should answer these questions:
- Does the dataset cover England or the whole UK?
- Is it reporting English Language, English Literature or both?
- Are the figures based on all entries or only particular pupils?
- Does “state” combine comprehensive, selective and other state-funded schools?
- Are results being compared at grade 444, grade 555 or grades 777 to 999?
- Are International GCSE qualifications included?
- Does the evidence show an association, or does it establish a cause?
Miss one of these details and a confident conclusion can become a misleading one.
What the latest official evidence shows
At the time of writing, the latest complete summer GCSE results series is from 2025. The principal sources for interpreting these outcomes are the Joint Council for Qualifications, Ofqual and the Department for Education. They publish different kinds of information, so their figures should not be treated as interchangeable.
| Source | Main coverage |
|---|---|
| Joint Council for Qualifications | Entries and grade outcomes across participating UK awarding organisations |
| Ofqual | Regulated qualifications in England, including subject-level results and group analyses |
| Department for Education | English schools, pupil characteristics and accountability measures |
JCQ results tables describe entries and grade outcomes across participating UK awarding organisations. Ofqual provides detailed evidence for regulated qualifications in England, including subject-level results and analyses of differences between groups. Department for Education performance data focuses mainly on English schools, pupil characteristics and accountability measures.
Across recent official series, independent schools have generally recorded a larger share of grades 777 to 999 than non-selective state schools. Selective state schools also tend to have high top-grade proportions. This matters because a simple “state versus private” label can hide substantial variation within the state sector.
The pattern does not mean that every private school outperforms every state school. Nor does it mean that the gap is identical in English Language and English Literature. National figures describe groups containing thousands of pupils; schools and individual students can sit far above or below their group average.
English Language and English Literature are different datasets
English Language and English Literature are related subjects, but they do not have identical entry populations.
English Language has a particularly broad cohort because achieving an approved pass in English is central to post-161616 progression. Students who have not achieved the required outcome may also continue with English after Year 111111, subject to current funding and resit requirements.
English Literature entry can vary more between schools and pupils. Entry policies, curriculum decisions and the use of alternative qualifications may therefore affect the group appearing in the published figures. A difference in Literature outcomes may partly reflect who was entered, rather than only what happened in the examination room.
This is known as a selection effect. If two percentages come from differently composed groups, subtracting them gives a numerical gap, but not automatically a fair comparison.
How to read a grade gap correctly
Suppose an official table gives the proportion reaching a chosen grade threshold in each school category. The percentage-point gap is:
gap=pprivate−pstate\text{gap}=p_{\text{private}}-p_{\text{state}}gap=pprivate−pstateThat calculation describes the observed difference. It does not explain it.
It is also important to distinguish percentage points from per cent. If two reported proportions differ, the direct subtraction produces a percentage-point gap. A relative percentage change answers another question and can make a difference appear larger than it first seemed.
The grade threshold matters too. Comparing achievement at grade 444 asks how many pupils reached the standard pass benchmark. Grade 555 is commonly described in school performance measures as a strong pass, while grades 777 to 999 focus on higher attainment. One school type could have a modest difference at one threshold and a wider difference at another.
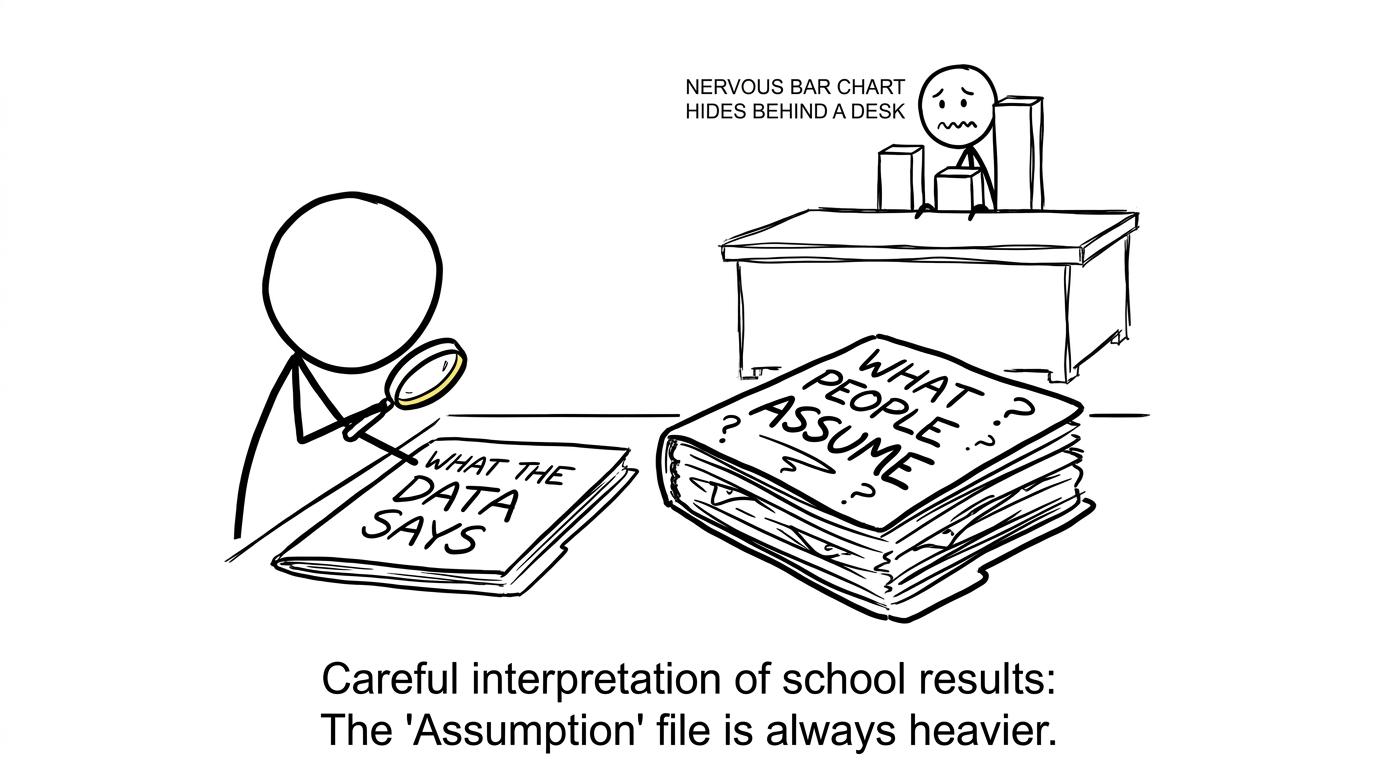 A student detective separates evidence from assumptions
What the results do not tell you
The most important lesson in the table often lies outside it.
They do not prove that school type caused the grades
A raw comparison is observational. Pupils are not allocated randomly to state and private schools, so the groups can differ before GCSE teaching begins.
Prior attainment, selection, household income, special educational needs, English as an additional language, location, attendance and access to support may all be relevant. Some independent and selective schools also use admissions processes that affect the prior-attainment profile of their intake.
Statistical analysis can adjust for measurable characteristics, but even an adjusted association should not casually be described as proof of cause. Not every relevant difference can be observed or measured perfectly.
They do not measure teaching quality on their own
Exam results matter, but a school-level percentage is not a complete evaluation of teaching. It combines the pupils admitted, their starting points, curriculum decisions, attendance, examination entries and experiences outside school.
Progress measures can add context by considering prior attainment, yet they also require careful interpretation. A single headline outcome cannot capture the quality of every classroom or every teacher.
They may not contain all independent-school qualifications
Some independent schools enter pupils for International GCSE qualifications. These are not automatically represented in a dataset covering domestic GCSE entries. Consequently, a GCSE-only comparison may omit part of the independent sector's English qualification picture.
Always read the dataset's qualification coverage before treating it as a complete account of private-school performance.
They do not predict your result
A group average is not an individual ceiling. It says nothing about the exact questions you can answer today, the feedback you will act on tomorrow or the habits you can build before the examination.
The same principle applies to maths. National averages provide context, but they cannot replace diagnosis. The GCSE maths revision resources let you identify specific topics, watch revision videos and answer questions at the appropriate level.
Why this matters to a maths student
English results may seem distant from algebra or geometry, but the way you interpret them is mathematical. You are dealing with populations, samples, categories, percentages and possible confounding variables. These are the foundations of responsible statistical reasoning.
When a headline reports that one group “did better”, ask:
- Which average or proportion was used?
- What was the denominator?
- Were the groups selected in the same way?
- Were the same qualifications counted?
- Is the difference an association or a cause?
That habit is valuable in GCSE statistics questions and beyond. A graph can be numerically correct while encouraging an unjustified conclusion. Good mathematics includes knowing where the evidence ends.
If data handling is a weaker area, begin with the structured lessons on the Grade 4 GCSE maths revision page, then move towards the interpretation and problem-solving found in Grade 5 revision and Grade 6 revision.
What has more influence over your next grade
You cannot revise a school-sector statistic. You can revise a topic.
A useful cycle is simple: identify a weakness, review the method, answer practice questions, check the mark scheme and return to mistakes after a short gap. For students aiming at higher grades, the Grade 7 GCSE maths resources provide progressively demanding questions without requiring you to guess what to learn next.
Past papers then help you combine topics under exam conditions. MathsGenie's GCSE maths past papers support this stage with mark schemes and video solutions, while the predicted papers offer further exam-style practice.
The purpose is not to complete the largest possible stack of papers. It is to notice why marks were lost. A misunderstood command word requires a different response from an algebra error or poor time management.
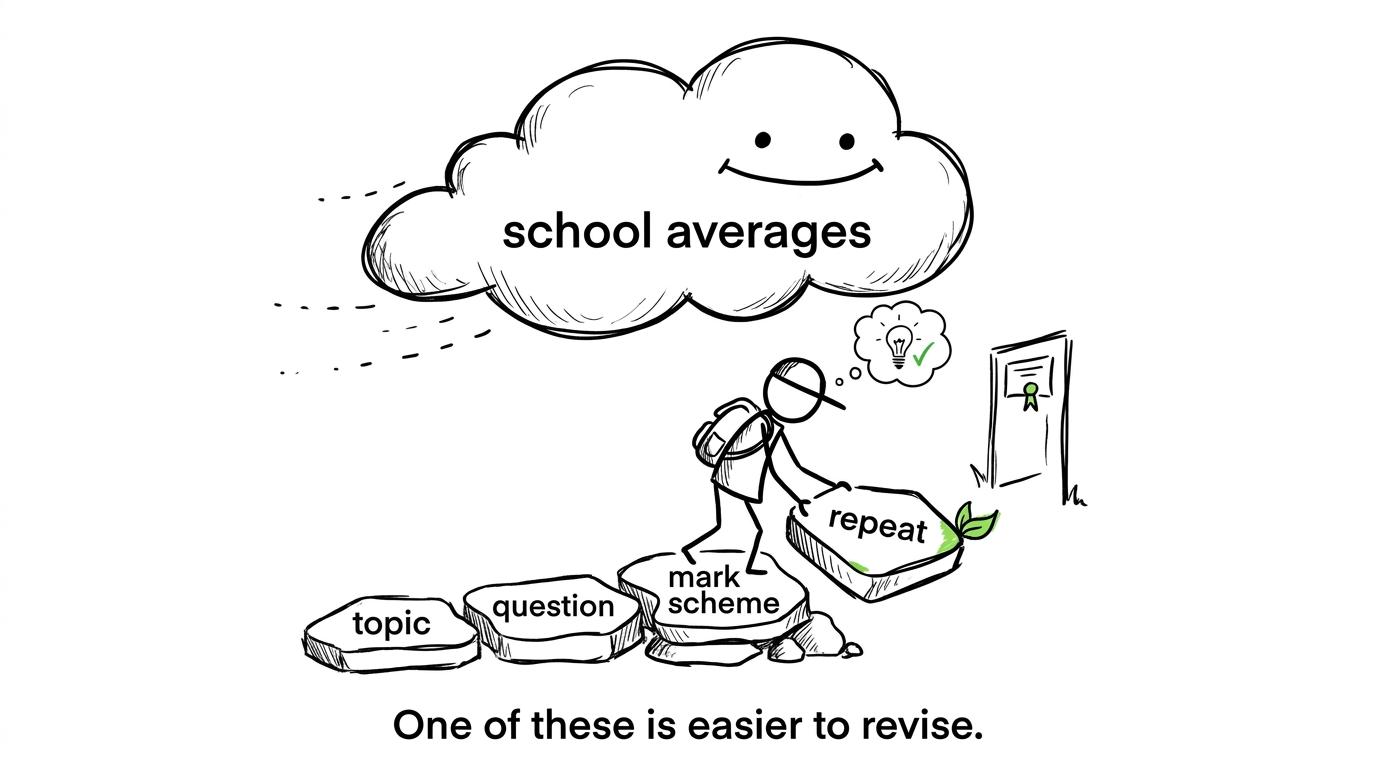 A student crosses stepping stones from topics to mark schemes
Common mistakes when interpreting school results
Treating private and selective as the same category
Independent schools charge fees and sit outside the state-funded sector. Grammar schools are selective but state funded. Combining or confusing these groups distorts the comparison.
Comparing figures from different nations or years
England, Wales and Northern Ireland have different qualification and grading arrangements. Scotland uses a different qualifications system. A UK table and an England-only table may therefore have different coverage.
Results also change between years. Pandemic-era assessment arrangements, the return to examinations and subsequent grading policies make casual comparisons across long periods particularly risky.
Assuming grade boundaries favour a school type
Awarding organisations set grade boundaries for a qualification and examination series, not separately for state and private pupils. Students taking the same specification with the same exam board are assessed against the same requirements. Boundaries may differ between Edexcel, AQA, OCR and Eduqas papers because the papers are different, not because candidates attend different school types.
Ignoring entries and subject choice
A percentage without an entry count can conceal a small or selective cohort. English Literature figures especially should be read alongside information about who entered the qualification.
Turning correlation into a promise
Higher average attainment in one category does not guarantee a particular pupil's result. Equally, attending a school category with a lower average does not prevent a top grade.
The conclusion that is actually useful
Official GCSE data supports a careful conclusion: independent schools generally achieve higher proportions of top English grades than non-selective state schools, while selective state schools also perform strongly. But GCSE English Language and Literature results do not isolate the effect of school type, and they do not provide a like-for-like account unless entry patterns, pupil backgrounds, qualification coverage and grade thresholds are considered.
The table describes where groups finished. It does not decide where you will finish.
For your own exams, begin with MathsGenie's free GCSE revision lessons, use practice questions and mini tests to expose gaps, then complete past papers and predicted papers under timed conditions. Check every mark scheme, watch the video solutions and let your next action be guided by evidence you can change.