GCSE Biology State vs Private Results Explained
GCSE Biology state vs private results reveal an attainment gap, but school type alone does not explain it. Learn what the latest data really shows.
A national average can feel strangely personal. You see that one school type records more top grades than another and begin wondering whether your own result has already been decided. It has not.
The short answer on GCSE Biology state vs private results is that independent schools record substantially more top GCSE grades overall than non-selective state schools. However, the latest headline figures cover all GCSE subjects combined, while national Biology figures describe everyone together. Putting those statistics side by side does not prove the size or cause of a Biology-specific school gap.
That distinction matters. The data identifies patterns between groups. It does not set a ceiling on an individual student.
The quick data checklist
Before drawing conclusions, check five things:
- Is the figure for Biology alone or all GCSE subjects?
- Does “state school” include selective grammar schools?
- Are we counting candidates, entries or awarded results?
- Are the percentages measuring grades 777 to 999 or grades 444 to 999?
- Does the evidence show an association, or can it establish a cause?
These are the same habits needed for interpreting tables, sampling and misleading graphs in GCSE maths. You can strengthen them through the free GCSE Statistics revision hub, which includes exam questions, worksheets and past papers.
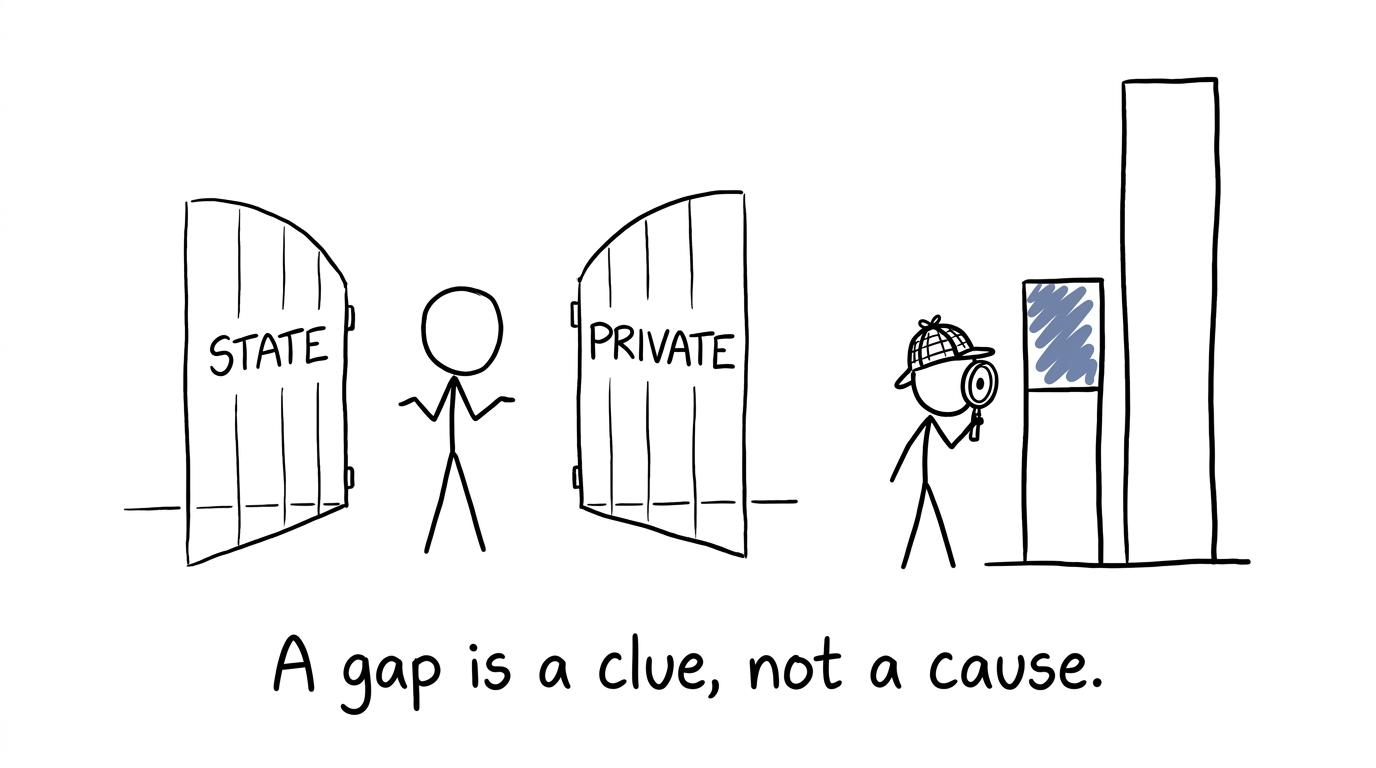 A statistics detective investigates state and private school results
What the latest GCSE results show
The most recent complete summer results available are for 202520252025. JCQ reported 170,055170{,}055170,055 GCSE Biology entries in England. Of those entries, approximately 43.4%43.4\%43.4% received grade 777 or above and 89.4%89.4\%89.4% received grade 444 or above.
These are Biology figures for England as a whole. They do not, by themselves, separate state and independent schools.
Ofqual’s published centre-type figures show the following pattern across all GCSE subjects combined in England:
| Centre type | Grade 777 or above | Grade 444 or above |
|---|---|---|
| All state-funded centres | 20.7%20.7\%20.7% | 66.5%66.5\%66.5% |
| Secondary comprehensive or middle schools | 19.7%19.7\%19.7% | 68.5%68.5\%68.5% |
| Secondary selective schools | 63.2%63.2\%63.2% | 97.4%97.4\%97.4% |
| Independent schools | 48.1%48.1\%48.1% | 89.6%89.6\%89.6% |
The difference between independent schools and all state-funded centres at grade 777 or above was therefore:
48.1%−20.7%=27.4 percentage points. 48.1\% - 20.7\% = 27.4\text{ percentage points}. 48.1%−20.7%=27.4 percentage points.Compared specifically with comprehensive and middle schools, the difference was:
48.1%−19.7%=28.4 percentage points. 48.1\% - 19.7\% = 28.4\text{ percentage points}. 48.1%−19.7%=28.4 percentage points.Those are large descriptive gaps. Yet the table also reveals why a simple “state versus private” headline can be misleading. Selective state schools recorded a higher proportion of top grades than independent schools. State education is not one uniform category.
Can we say private schools get better Biology grades?
We can say that GCSE outcomes differ considerably by centre type overall. Ofqual also provides an interactive centre-type dataset that can be filtered by subject, including Biology. But any Biology comparison must use the same year, subject filter, grade threshold and centre definitions throughout.
What we should not do is compare the national Biology rate of 43.4%43.4\%43.4% at grade 777 or above with the all-subject state rate of 20.7%20.7\%20.7%, then call the difference a Biology school-type gap. The groups and variables are different.
Separate-science Biology is also not the same qualification as Combined Science. Entry patterns may vary between schools, so the students represented in GCSE Biology data are not necessarily comparable with every Year 111111 pupil. A high percentage among Biology entries does not tell us what proportion of a school’s whole cohort was entered for separate Biology.
For students, this is an important lesson in statistical discipline: two accurate figures can produce an inaccurate story when their definitions do not match.
Why the results cannot identify one cause
An observed difference can be written as:
attainment gap=percentage for group A−percentage for group B. \text{attainment gap} = \text{percentage for group A} - \text{percentage for group B}. attainment gap=percentage for group A−percentage for group B.That calculation describes the gap. It does not explain it.
School populations differ in prior attainment, admissions, location, disadvantage, special educational needs, subject entry and many other characteristics. Selective schools deliberately admit on academic criteria. Independent schools may also differ from state schools in their pupil intake and available resources. These factors can overlap.
The centre-type results are therefore observational data, not a controlled experiment. Students were not randomly allocated to state and private schools while every other factor was held constant. It would be unjustified to conclude that changing school type alone causes a particular increase in Biology grade.
A stronger causal analysis would need pupil-level information and careful adjustment for relevant background differences. Even then, researchers would need to be cautious about unmeasured factors.
This idea connects directly to correlation in GCSE maths. A relationship between two variables can be real without one variable being the sole cause of the other. The Edexcel GCSE Statistics resources can help you practise sampling, association and data interpretation in an exam-focused setting.
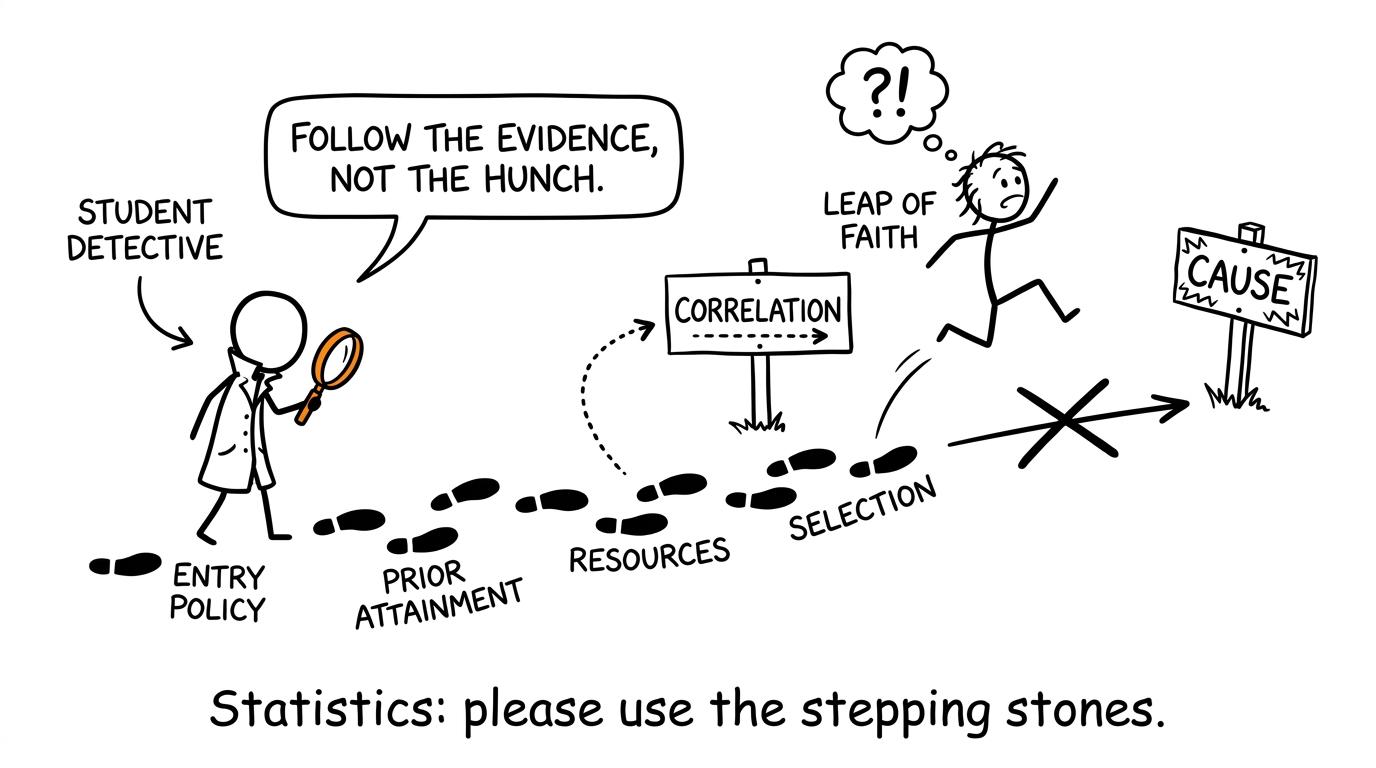 A student follows statistical stepping stones instead of jumping to causation
What the figures do and do not tell you
The evidence does show
- Independent centres had a higher proportion of grades 777 and above than comprehensives across all GCSE subjects in England in 202520252025.
- Selective state schools had the highest top-grade proportion among the major centre types shown.
- GCSE Biology had a relatively high national grade profile, with about 43.4%43.4\%43.4% of English entries receiving grade 777 or above.
- Results vary substantially within the state sector, so combining every state-funded centre can conceal important differences.
The evidence does not show
- That every private school outperforms every state school.
- That an individual student would receive a different grade merely by changing school type.
- That resources, selection or any single factor independently caused the observed gap.
- That the national Biology percentage is a private-school percentage.
- That Combined Science and separate Biology entries can be treated as one identical group.
The word “average” smooths away variation. Two schools can belong to the same category while having very different intakes, teaching arrangements and results. Likewise, two pupils in one classroom can finish with very different grades.
How to read school-results claims critically
When a chart or headline appears, begin with the denominator. If nnn entries are considered and rrr reach the threshold, the reported percentage is:
rn×100%. \frac{r}{n}\times 100\%. nr×100%.Next, inspect what nnn includes. Is it every pupil, every GCSE result, or only separate Biology entries? Then check whether the threshold is grade 444 or grade 777. Both may be described informally as a “pass” or “strong result”, but they answer different questions.
Finally, check the year and geography. JCQ publishes UK and nation-level subject outcomes, while Ofqual regulates qualifications in England. Mixing UK Biology data with English centre-type data weakens the comparison.
These checks are useful beyond this topic. GCSE maths questions from Edexcel, AQA, OCR and Eduqas often reward precise interpretation rather than complicated calculation. The GCSE maths topics by board and tier guide shows where statistics and probability fit within your specification.
Why national averages should not control your revision
Averages describe groups after examinations have happened. Revision changes what you can do before your examination happens.
Your useful data is closer to home: marks lost on a mini test, questions you could not start and methods that disappear under time pressure. That evidence is specific enough to guide an action.
Use this short loop:
- Complete a timed set matched to your exam board and tier.
- Mark it strictly using the mark scheme.
- Sort lost marks into knowledge, method, accuracy and interpretation.
- Revisit the weakest skill through a revision lesson.
- Practise fresh questions and retest after a short gap.
Start with the MathsGenie GCSE maths revision hub, or use Edexcel GCSE maths mini tests when you need a shorter diagnostic task. The guide to finding your weakest GCSE topics helps turn marks into a focused plan rather than a vague judgement about ability.
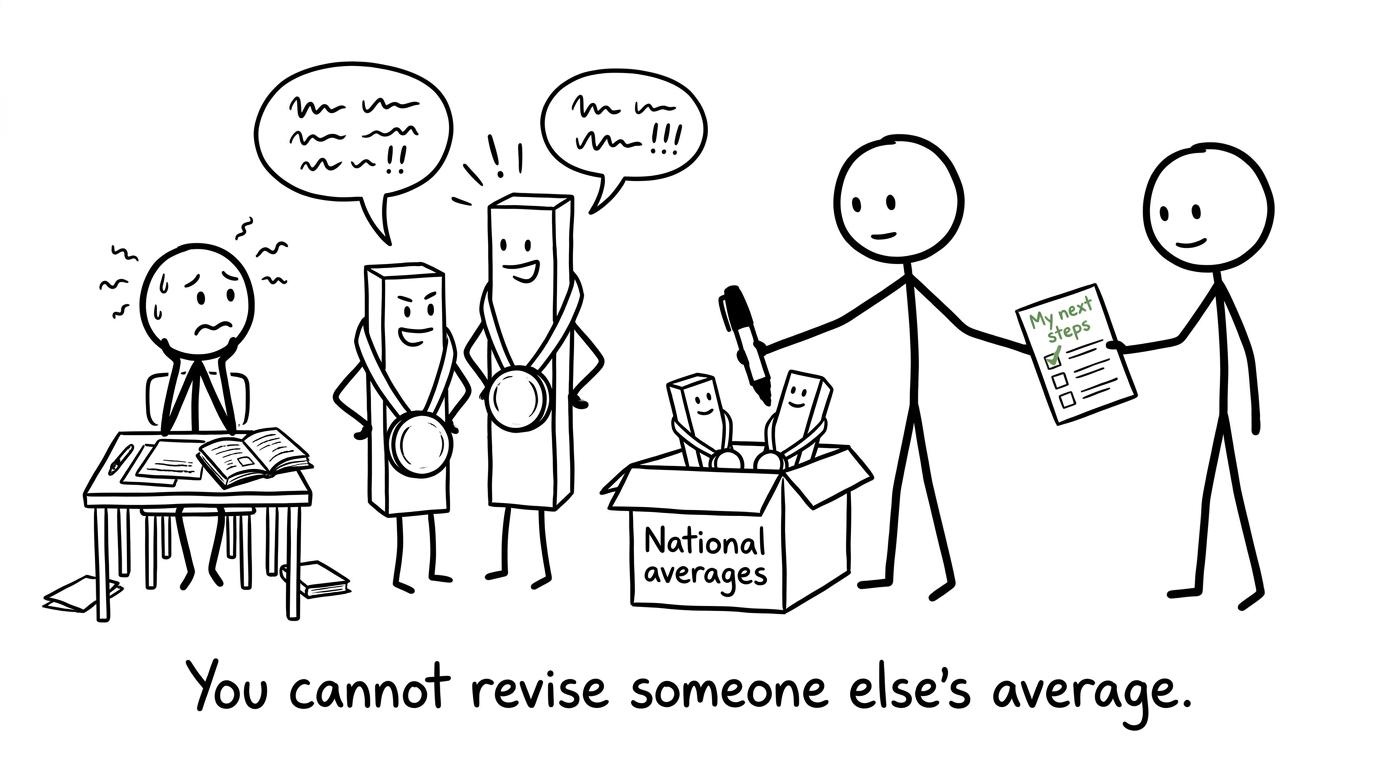 National averages try to distract a student from a practical revision checklist
Common mistakes when comparing school results
Confusing percentage points with percentage change
A movement from 20%20\%20% to 30%30\%30% is an increase of 101010 percentage points. Relative to the original value, it is a percentage increase of:
30−2020×100%=50%. \frac{30-20}{20}\times 100\% = 50\%. 2030−20×100%=50%.These descriptions are not interchangeable.
Comparing different subjects or populations
An all-subject private-school figure cannot directly establish a Biology-only gap. Both sides of a comparison must use matching definitions.
Treating association as causation
A higher result for one centre type does not prove that the label attached to the centre caused the result. Selection and pupil characteristics may affect both school type and attainment.
Ignoring entry policies
Separate Biology data covers entrants to that qualification. It should not automatically be generalised to pupils taking Combined Science or to an entire year group.
Assuming an average predicts an individual
A group percentage is not your personal probability of receiving a grade. Your preparation, paper performance and mark total determine your outcome within the grading process.
Turn comparison into useful evidence
The honest conclusion is balanced. GCSE grades do differ substantially between school types at national level, especially at grades 777 to 999. But the headline gap is not a clean measure of school effectiveness, and broad all-subject results should not be presented as if they were automatically Biology-specific.
Good statistics creates better questions. Good revision creates better answers.
Use MathsGenie as your free revision base: follow clear revision lessons, complete practice questions, check mark schemes and video solutions, then build confidence with mini tests, past papers and predicted papers. The GCSE revision timetable guide can help you organise that cycle, while the guide to using GCSE past papers properly shows how to convert every lost mark into a practical next step.
A national statistic tells you where groups finished. Your next focused session helps decide where you finish.