An object oscillates with simple harmonic motion. Let Ek E_k\,Ek represent the kinetic energy and Ep E_p\,Ep represent the potential energy of the oscillating system.
Which graph best shows how the kinetic energy Ek E_k\,Ek varies with the potential energy Ep E_p\,Ep during the motion?
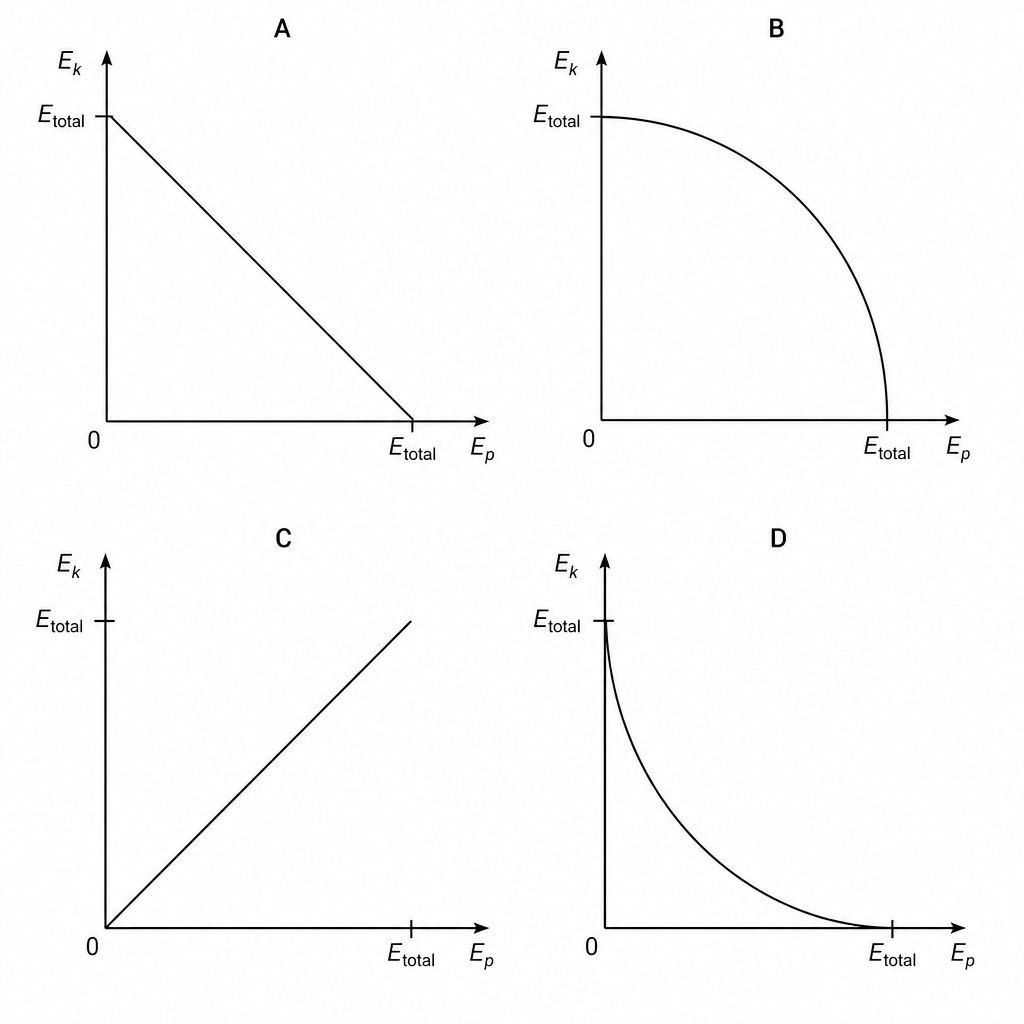
Graph A
Graph B
Graph C
Graph D