Integration
123456789101112131415161718192021222324252627282930313233343536373839404142434445464748495051525354555657585960616263646566676869707172737475767778798081828384858687888990919293949596979899100101102103104105106107108109110111112113114115116117118119120121122123124125126127128129130131132133134135136137138139140141142143144145146147148149150151152153154155156157158159160161162163164165166167168169170171172173174175176177178179180181182183184185186187188189190191192193194195196197198199200201202203204205206207208209210211212213214215216217218219220221222223224225226227228229230231232233234235236237238239240241242243244245246247248249250251252253254255256257258259260261262263264265266267268269270271272273274275276277278279280281282283284285286287288289290291292293294295296297298299300301302303304305306307308309310311312313314315316317318319320321322323324325326327328329330331332333334335336337338339340341342343344345346347348349350351352353354355356357358359360361362363364365366367368369370371372373374375376377378379380381382383384385386387388389390391392393394395396397398399400401402403404405406407408409410411412413414415416417418419420421422423424425426427428429430431432433434435436437438439440441442443444445446447448449450451452453454455456457458459460461462463464465466467468469470471472473474475476477478479480481482483484485486487488489490491492493494495496497498499500501502503504505506507508509510511512513514515516517518519520521522523524525526527528529530531532533
Question 417
The power output, P P\,P kW, of a solar array is monitored over a 12-hour period. The graph of P P\,P against time ttt (hours after 00:00) shows the system's performance between t=8t = 8t=8 and t=20t = 20t=20. Readings taken from the graph at regular 4-hour intervals are recorded in the table below.
t8121620P1.26.85.40.6 \begin{array}{|c|c|c|c|c|} \hline t & 8 & 12 & 16 & 20 \\ \hline P & 1.2 & 6.8 & 5.4 & 0.6 \\ \hline \end{array} tP81.2126.8165.4200.6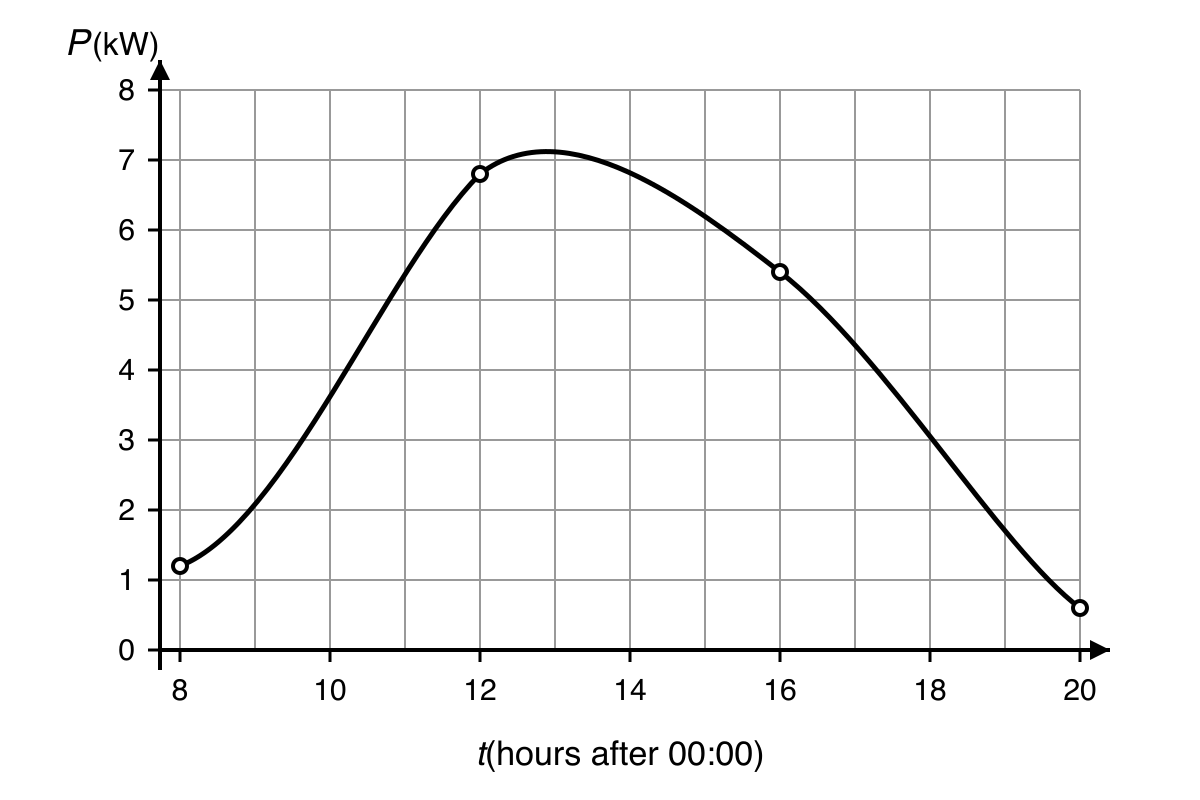
a.[4]
Use the trapezium rule with three strips of equal width to estimate the total energy produced, in kilowatt-hours (kWh), over the interval 8≤t≤208 \le t \le 208≤t≤20.
b.[1]
It is suggested that the power output P P\,P can be modelled by a quadratic function of t t\,t for 8≤t≤208 \le t \le 208≤t≤20. Explain how this model could be used to find an alternative estimate for the total energy produced during this time interval.
Integration Questions
864 exam-style questions on Edexcel A Level Maths Integration, covering 11.1 Integrating Standard Functions, 11.2 Integrating f(ax + b), 11.3 Using Trigonometric Identities, 11.4 Reverse Chain Rule, 11.5 Integration by Substitution, 11.6 Integration by Parts, 11.7 Partial Fractions, 11.8 Finding Areas, 11.9 The Trapezium Rule, 11.10 Solving Differential Equations, and 11.11 Modelling with Differential Equations. Each one has a worked solution and a mark scheme showing where the marks go.