Skip to content
MathsGenie logo
Open app

Course home

  1. A Level
  2. Biology OCR A
  3. Question bank

Practical skills assessed in a written examination

EasyMediumHard
1234567891011121314151617181920212223242526272829303132333435363738394041424344454647484950515253545556575859606162636465666768697071727374
Question 3

Dissolved oxygen saturation concentration is a measure of the maximum amount of oxygen that can be dissolved in water under given conditions of temperature and salinity.

The graph below shows the typical dissolved oxygen concentration at saturation for water of different temperatures and salinity levels.
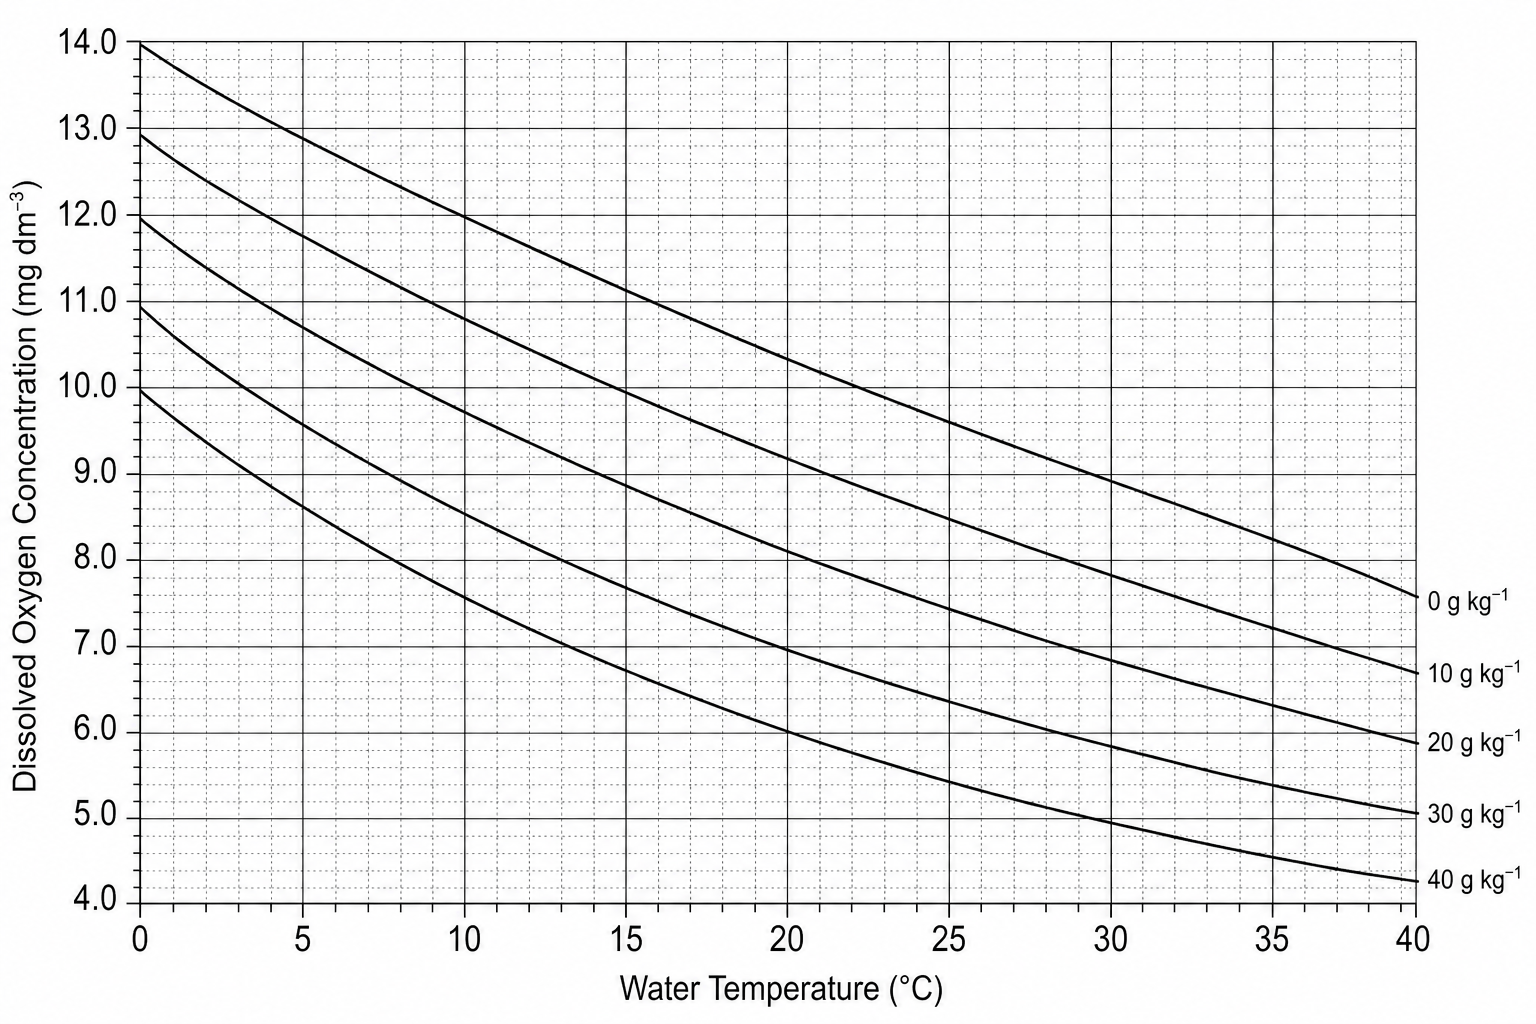
Graph showing the dissolved oxygen concentration on the y-axis ranging from 4.0 to 14.0 mg dm^-3, plotted against water temperature in degrees Celsius on the x-axis ranging from 0 to 40. Five curves are shown corresponding to salinity levels: 0, 10, 20, 30, and 40 g kg^-1.

Determine the percentage decrease in the dissolved oxygen saturation concentration when freshwater (salinity of 0 g kg−10\text{ g kg}^{-1}0 g kg−1) at 5 ∘C5\,^{\circ}\text{C}5∘C is replaced with saline water of salinity 30 g kg−130\text{ g kg}^{-1}30 g kg−1 at 30 ∘C30\,^{\circ}\text{C}30∘C. Give your answer to one decimal place.

[4]

Practical skills assessed in a written examination Questions

  1. A Level
  2. /Biology
  3. /Practical skills assessed in a written examination
