The graphs show changes in the concentration of nitrate and Secchi depth measurements in a reservoir over a 20-year period from 2000 to 2020.
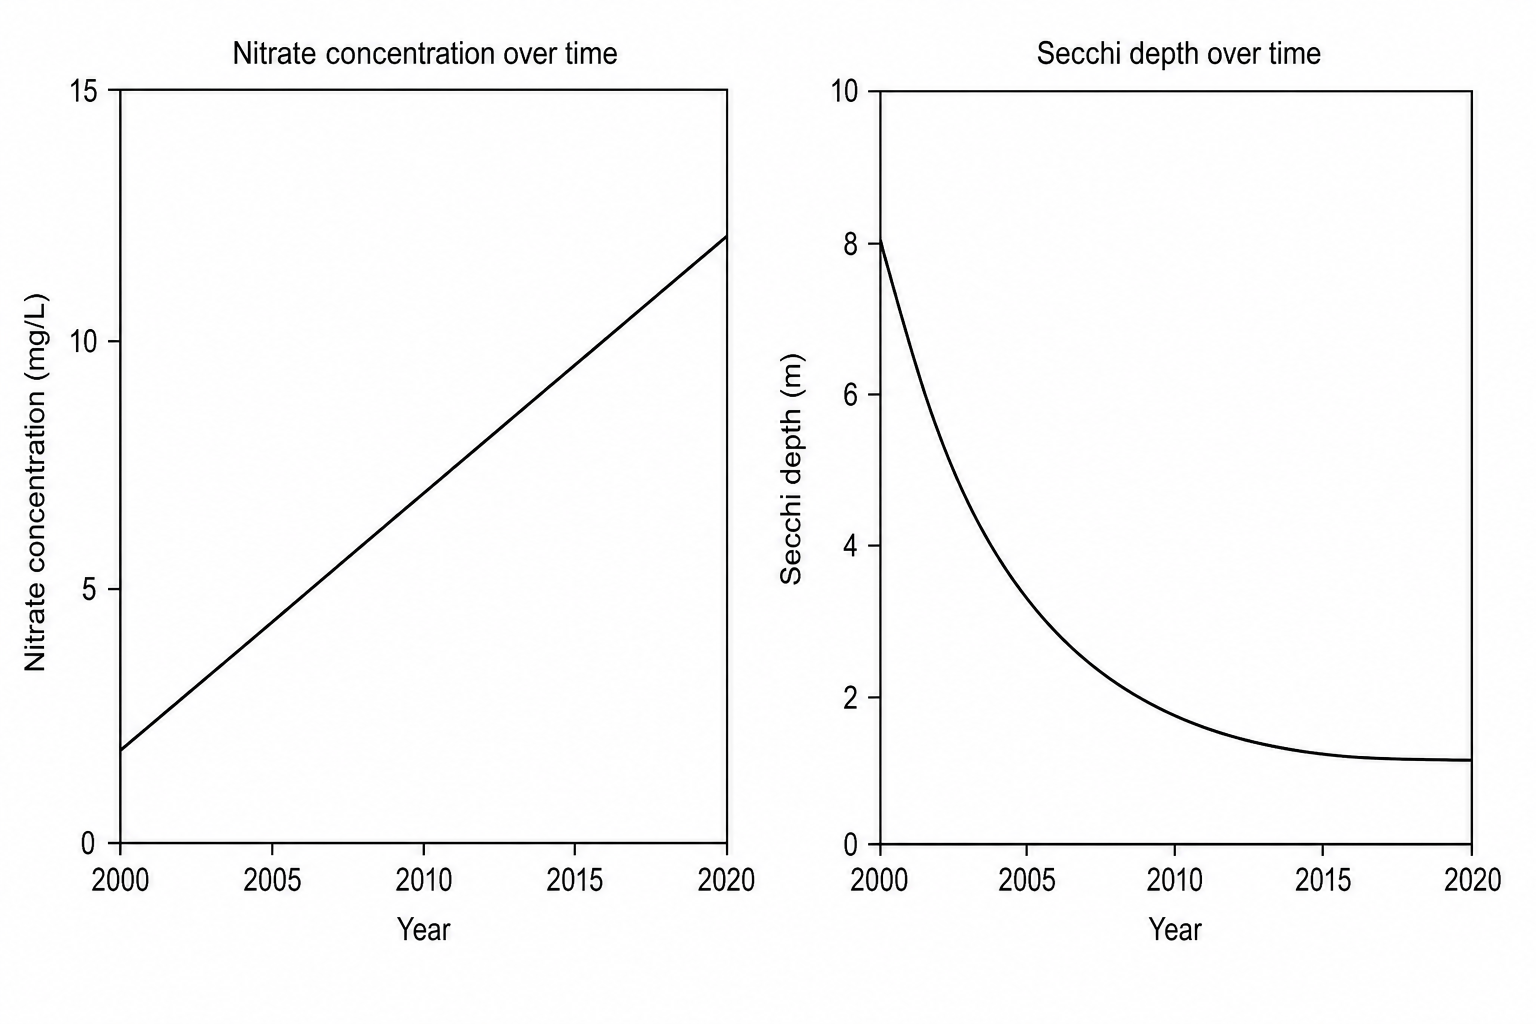
Describe the relationship between nitrate levels and Secchi depth over this 20-year period.
Over this 20-year period, the population of trout (a species of fish) in the reservoir decreased significantly. Explain how the changes in nitrate levels could cause this decrease in trout population.

