The graph shows the cumulative installed capacity of wind power and solar photovoltaics (PV) worldwide from 2000 to 2015.
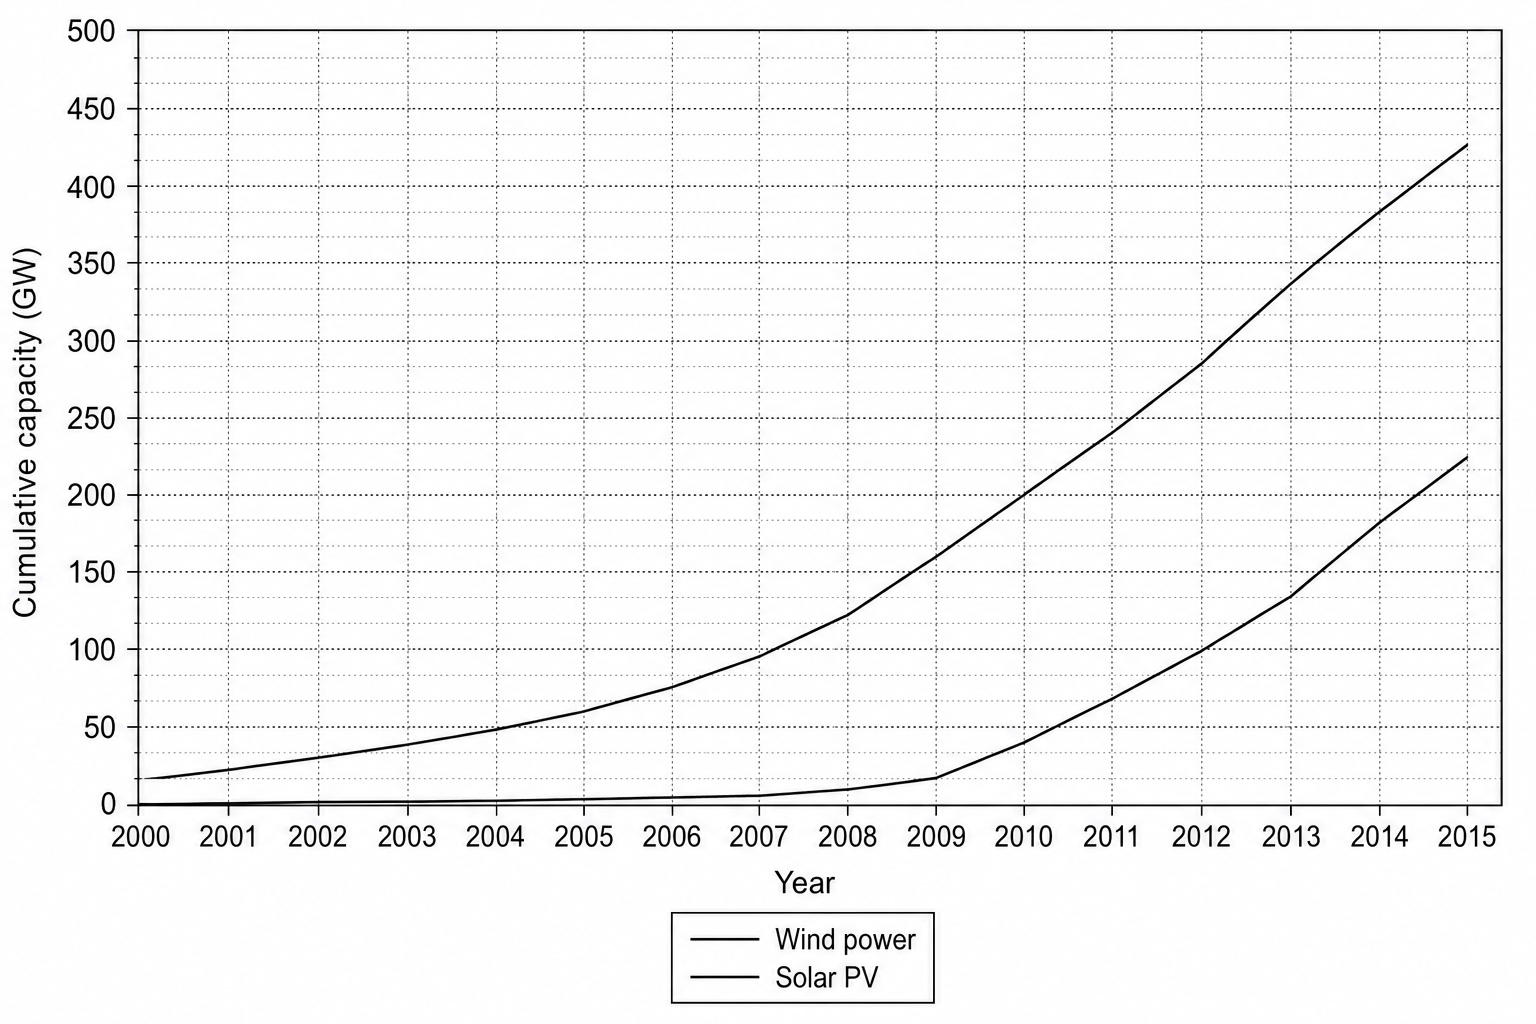
Describe the changes in the global cumulative capacity of wind power and solar PV since 2000.
By 2025, the global cumulative solar PV capacity is projected to be 4.5 times greater than it was in 2015. Calculate the projected solar PV capacity in 2025. Show your working.

