The graph in Figure 1 shows how the atmospheric pressure on the planet Venus varies with altitude above the surface.
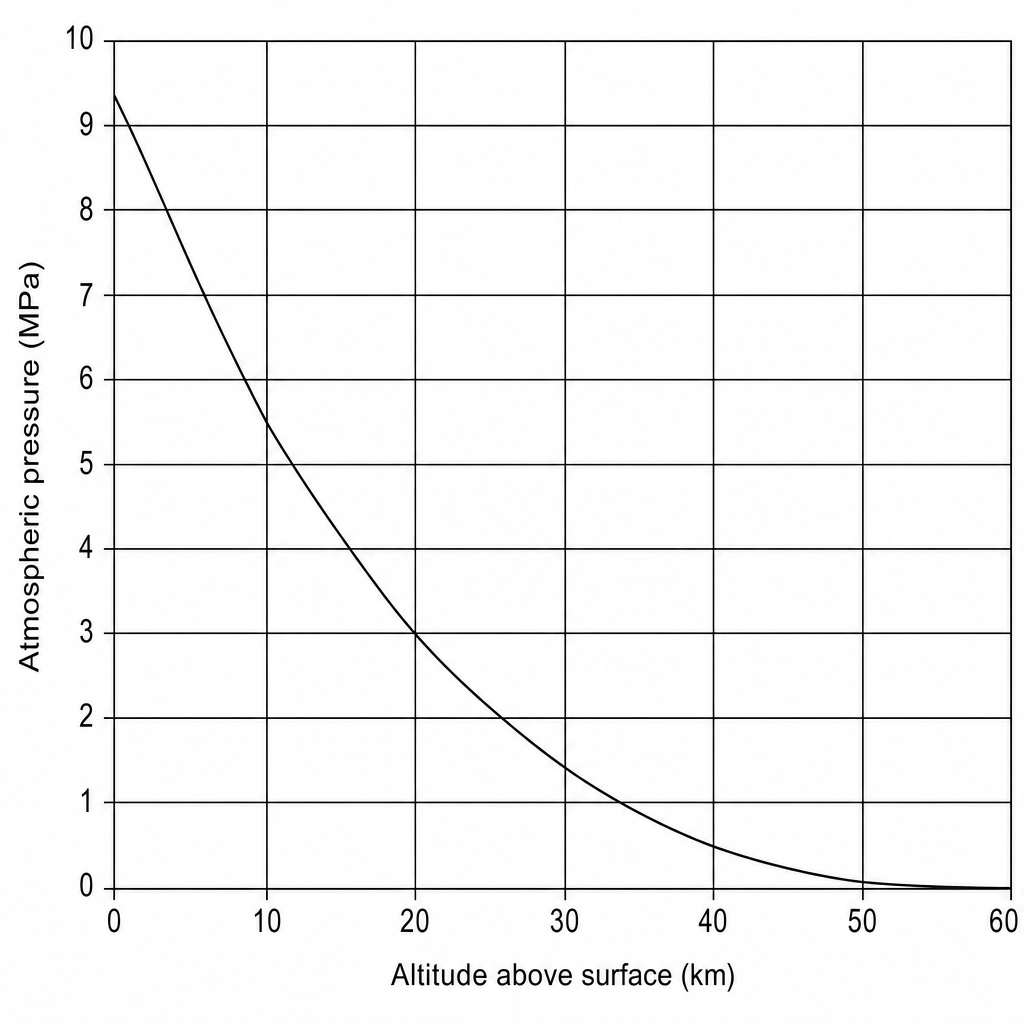
Data represented in the graph:
| Altitude above surface (km) | Atmospheric pressure (MPa) |
|---|---|
| 0 | 9.3 |
| 10 | 5.4 |
| 20 | 3.0 |
| 30 | 1.4 |
| 40 | 0.5 |
| 50 | 0.1 |
| 60 | 0.0 |
A robotic descent probe enters the atmosphere of Venus and descends from an altitude of 30 km to 10 km above the planet's surface.
Use the graph or the table to determine the change in atmospheric pressure experienced by the probe during this descent.