Pressure in fluids and upthrust

EasyMediumHard
123456789101112131415161718192021222324252627282930313233343536373839404142434445464748495051525354555657585960616263646566676869707172737475767778798081
Question 62
Easy

A student investigates how the total pressure in a column of vegetable oil varies with depth.

Their plotted results are shown on the graph below.
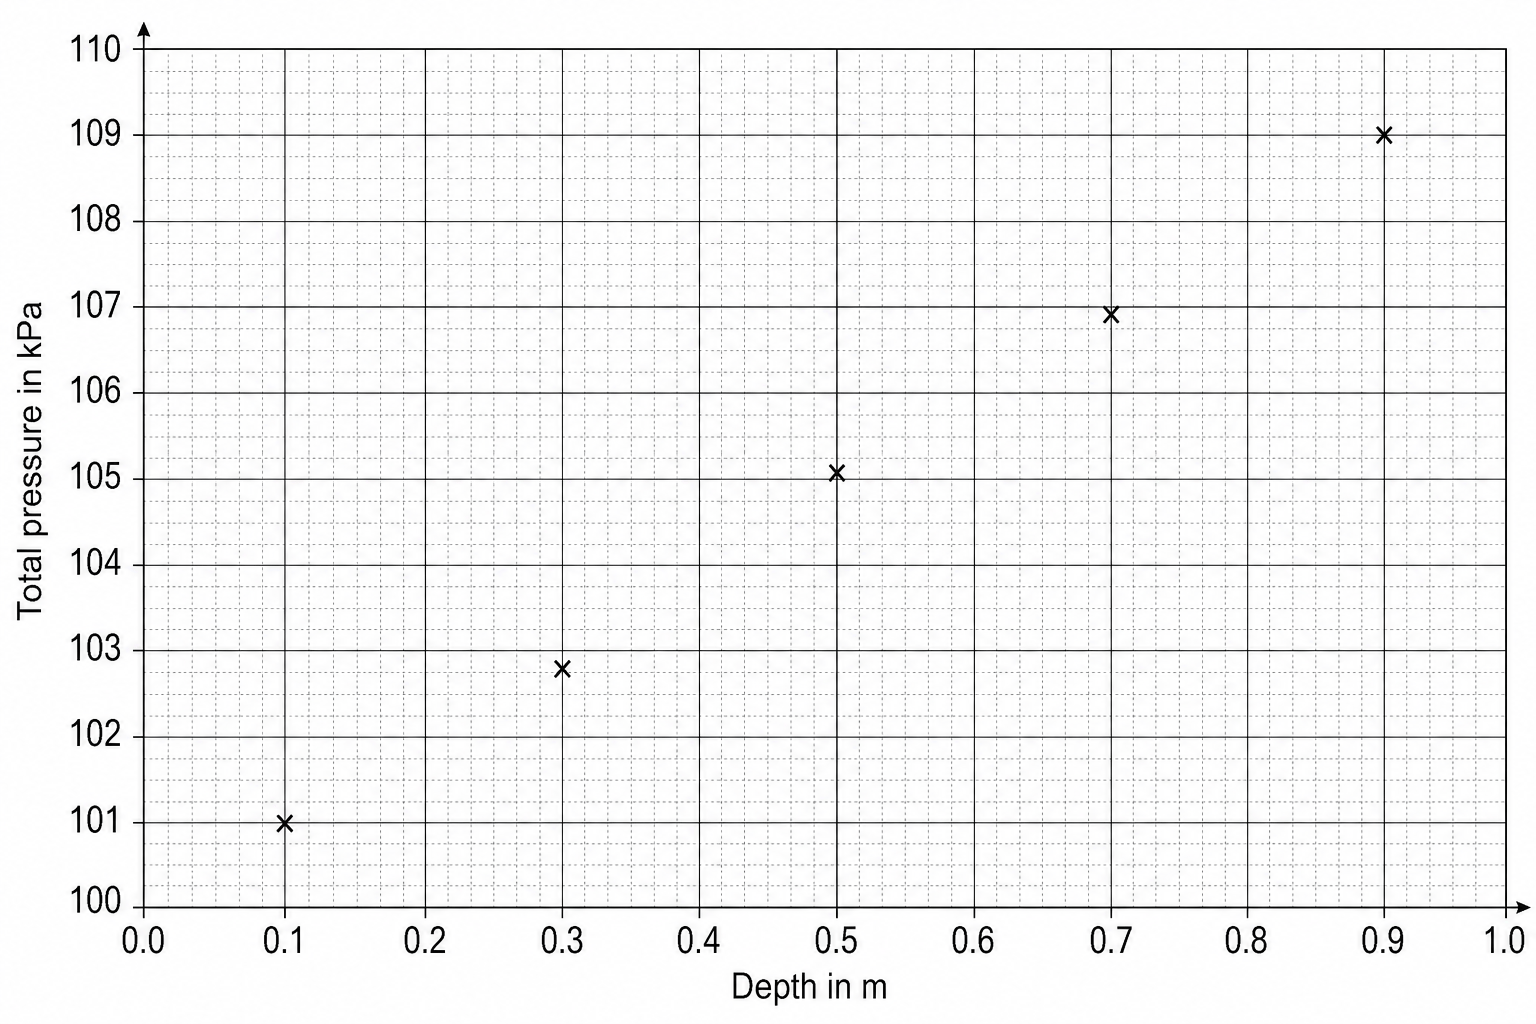
A graph of total pressure in kilopascals (kPa) on the vertical y-axis against depth in meters (m) on the horizontal x-axis. The y-axis is labeled 'Total pressure in kPa' and ranges from 100 to 110 kPa with major grid lines every 1 kPa. The x-axis is labeled 'Depth in m' and ranges from 0.0 to 1.0 m with major grid lines every 0.1 m. Five data points are plotted with 'x' marks at: (0.1, 101.0), (0.3, 102.8), (0.5, 105.1), (0.7, 106.9), and (0.9, 109.0).

Draw a line of best fit through the points on the graph.

[1]

Pressure in fluids and upthrust Questions

  1. GCSE
  2. /Physics
  3. /Pressure in fluids and upthrust