Photosynthesis

EasyMediumHard
123456789101112131415161718192021
Question 19
Medium

The graph shows how light intensity affects the rate of photosynthesis of a crop plant under different environmental conditions.
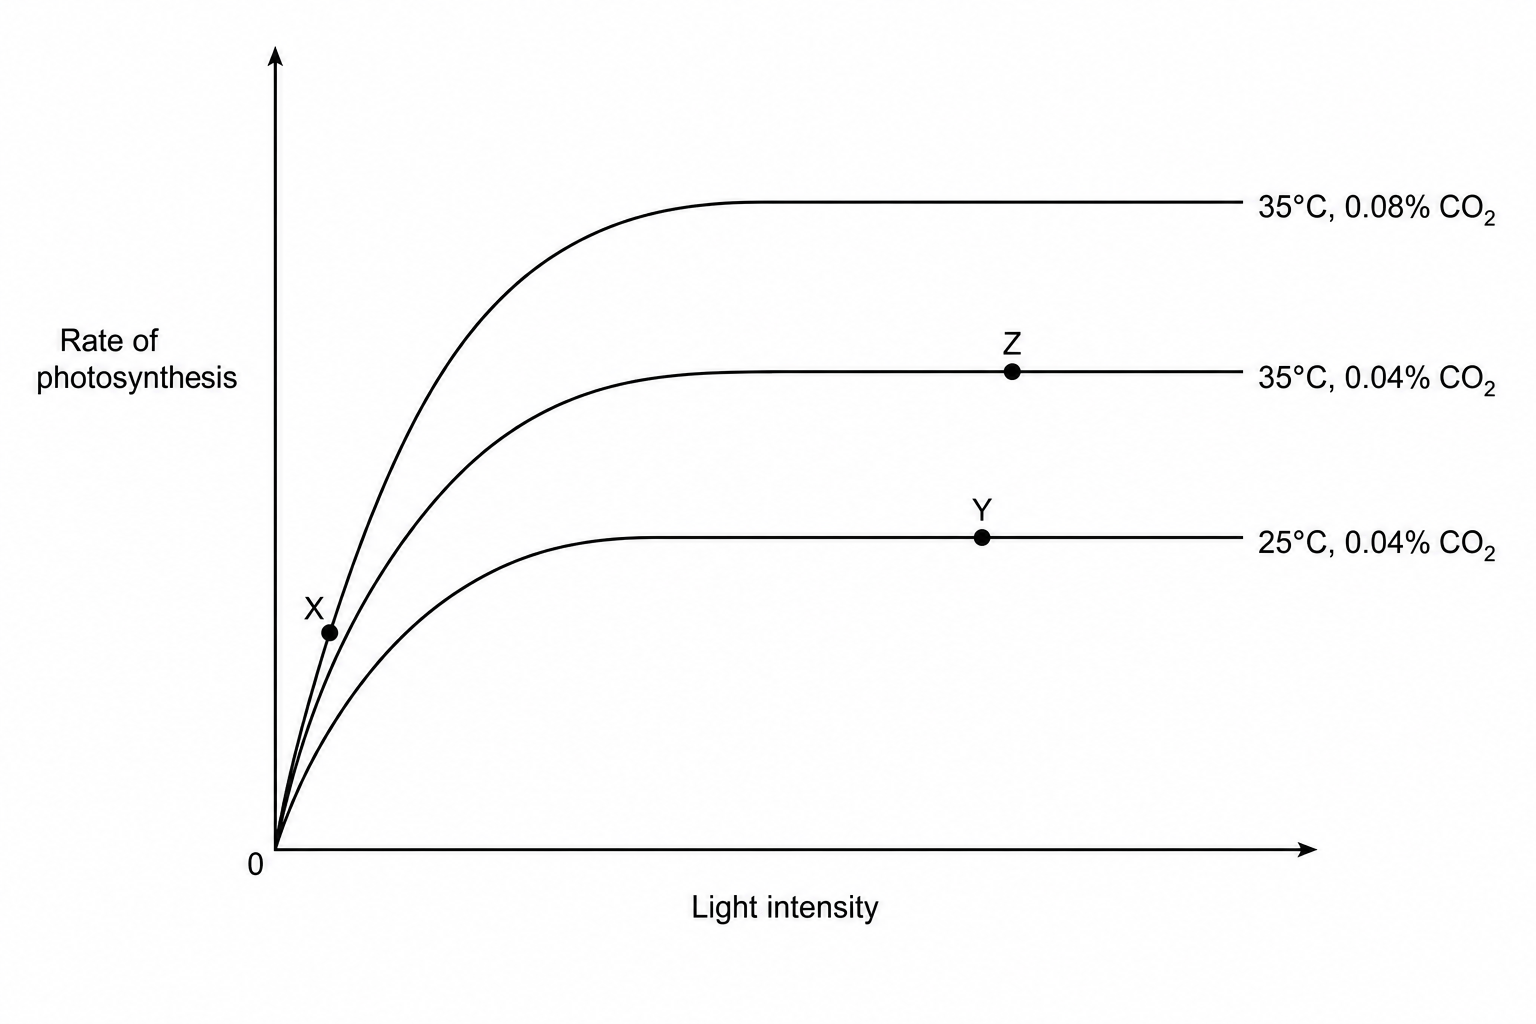
A graph showing rate of photosynthesis on the vertical axis against light intensity on the horizontal axis. Three curves start at the origin and rise steeply together. At very low light intensity, point X is located on this rising section where the curves coincide. The lowest curve levels off first at a low rate; this curve is labelled '25°C, 0.04% CO2' and has point Y on its flat horizontal region. The middle curve levels off at a higher rate; this curve is labelled '35°C, 0.04% CO2' and has point Z on its flat horizontal region. The highest curve levels off at the highest rate and is labelled '35°C, 0.08% CO2'.

Explain what is limiting the rate of photosynthesis at each of the points X, Y, and Z on the graph. Use evidence from the graph to support your explanations.

[6]

Photosynthesis Questions

  1. GCSE
  2. /Biology
  3. /Photosynthesis