The graph shows how light intensity affects the rate of photosynthesis of a crop plant under different environmental conditions.
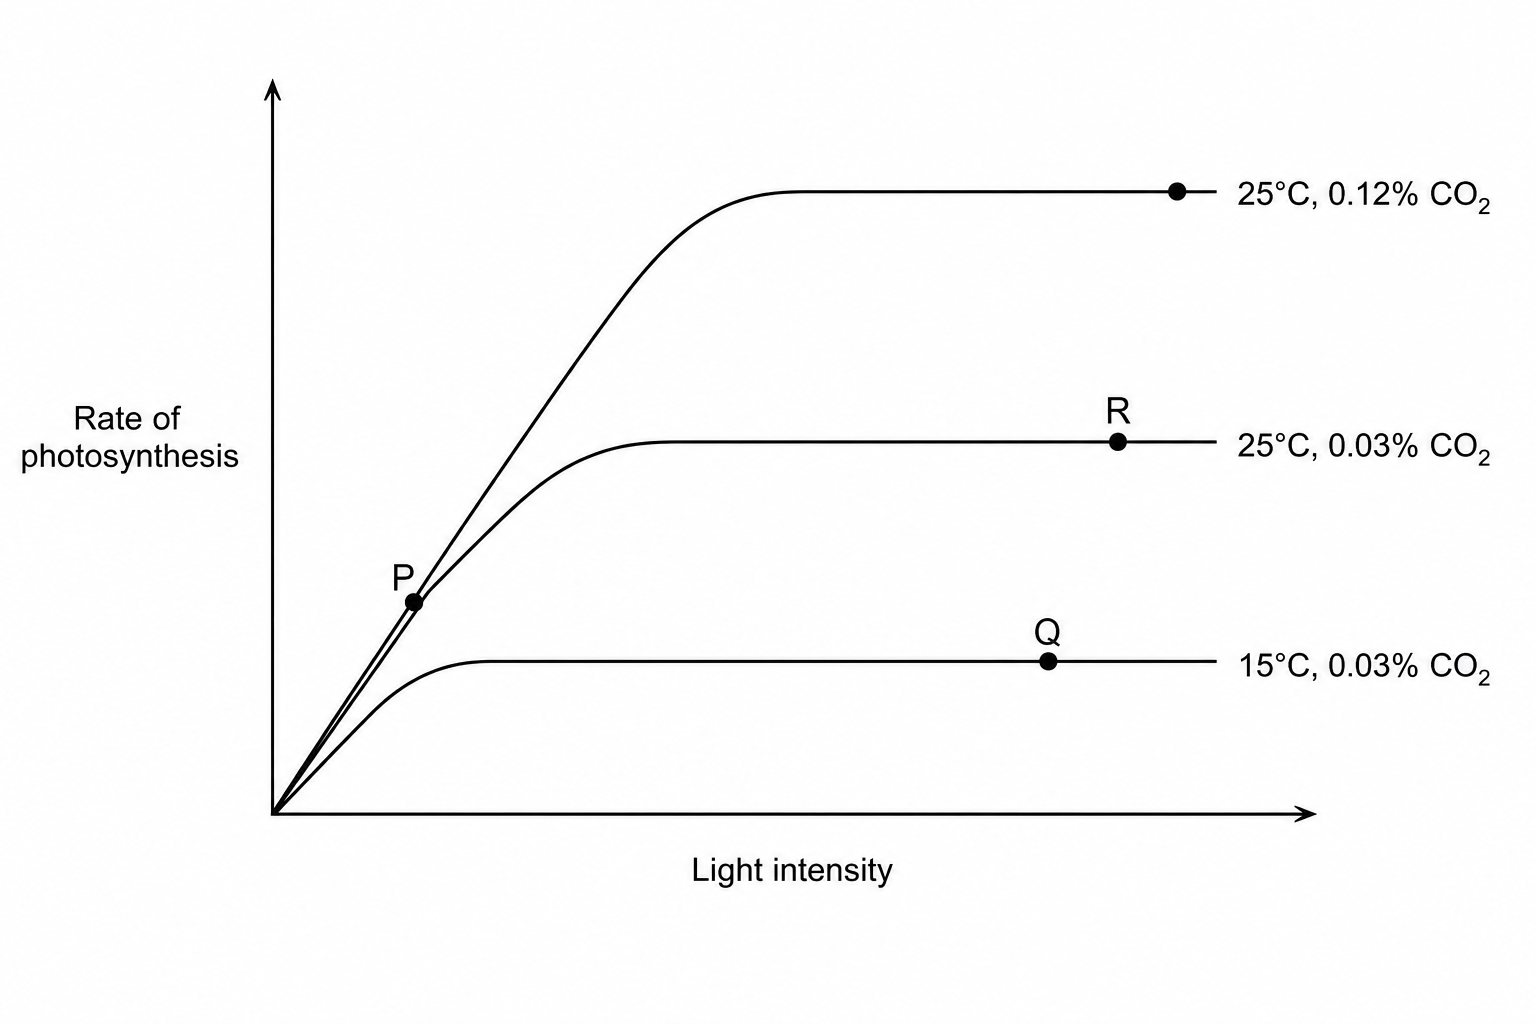
Explain what is limiting the rate of photosynthesis at each of the points P, Q, and R on the graph. Use evidence from the graph to support your explanations.