Question 4
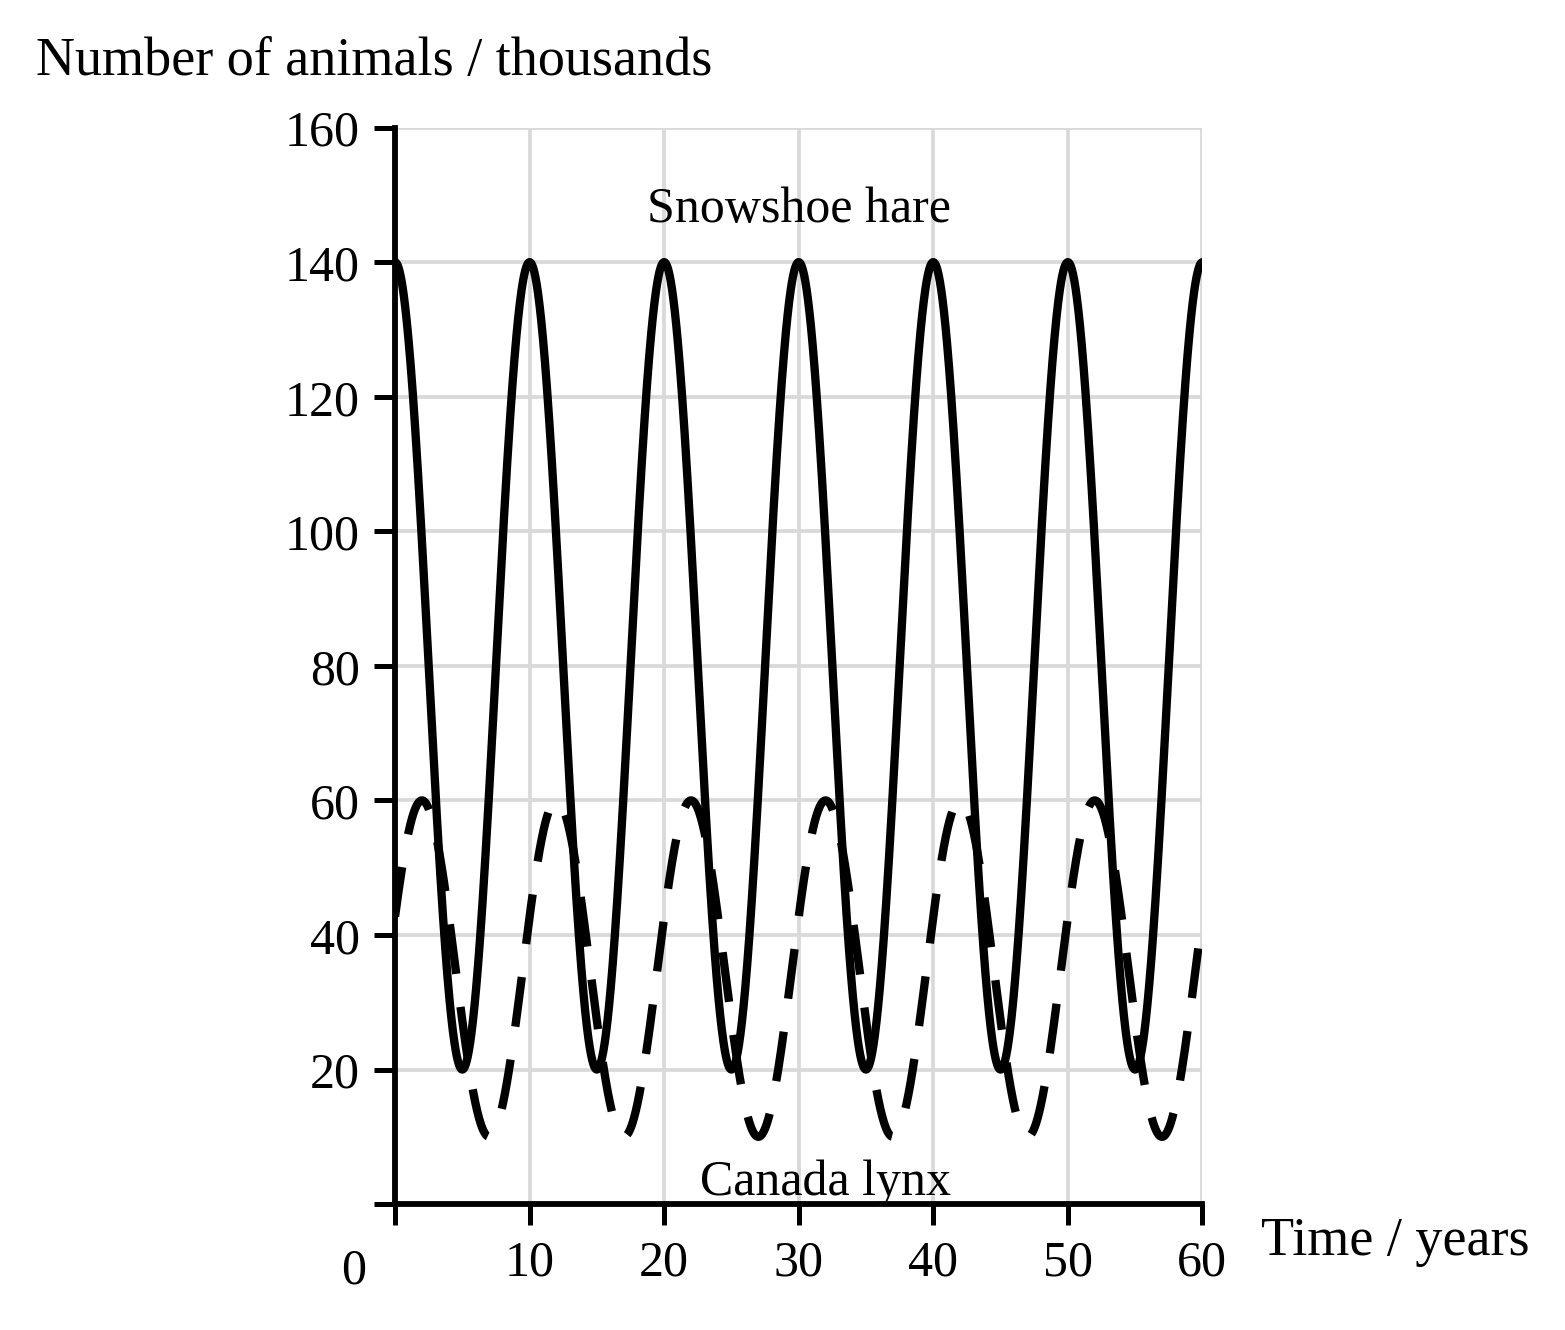
HFigure shows how the population sizes of the snowshoe hare and of its predator, the Canada lynx, changed over 60 years in a stable community.
Figure: The population sizes of the snowshoe hare and the Canada lynx over a period of 60 years
a.[2]
Describe the pattern shown by the two populations in Figure.
b.[3]
Explain why each peak in the lynx population comes after a peak in the hare population.
c.[2]
Over the 60 years the mean size of each population stays about the same. Explain what this shows about this community.
7.2 Organisation of an ecosystem Questions
38 exam-style questions on AQA GCSE Biology 7.2 Organisation of an ecosystem, covering 7.2.1 Levels of organisation, 7.2.2 How materials are cycled, 7.2.3 Decomposition, and 7.2.4 Impact of environmental change (HT only). Each one has a worked solution and a mark scheme showing where the marks go.