Question 5
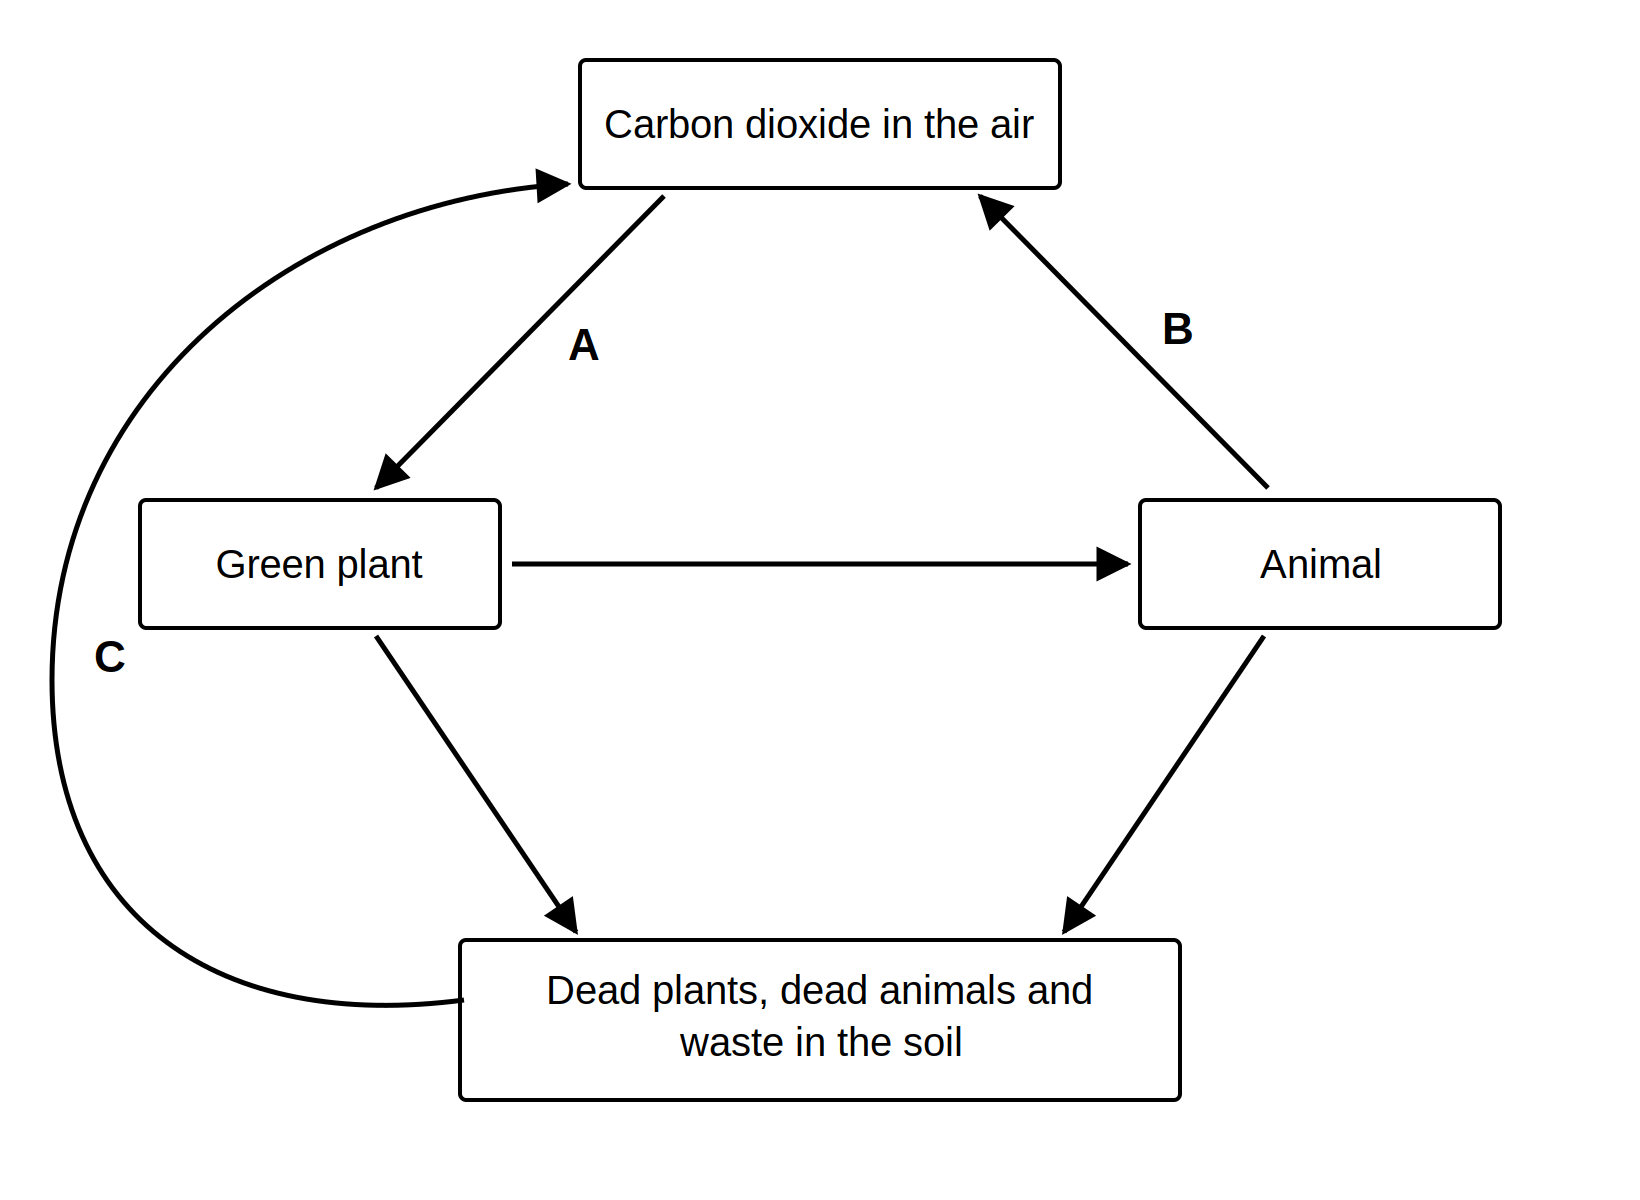
FFigure shows part of the carbon cycle. The arrows A, B and C show three processes.
Figure: Part of the carbon cycle, showing three processes labelled A, B and C
a.[1]
Name process A.
b.[1]
Name process B.
c.[1]
Name the type of organism that carries out process C.
d.[2]
Explain why the recycling of carbon is important for living organisms.
7.2 Organisation of an ecosystem Questions
38 exam-style questions on AQA GCSE Biology 7.2 Organisation of an ecosystem, covering 7.2.1 Levels of organisation, 7.2.2 How materials are cycled, 7.2.3 Decomposition, and 7.2.4 Impact of environmental change (HT only). Each one has a worked solution and a mark scheme showing where the marks go.