Velocity-Time Graphs GCSE Maths Mock Revision
Velocity-time graphs GCSE maths revision made clear: learn gradients, areas and exam methods, then practise confidently for your Year 11 mock exam well.

December mocks have a way of making every topic feel urgent at once. A Year 11 student may open a revision list, see velocity-time graphs and remember fragments: gradient means something, area means something else, and a flat line might mean the object has stopped.
Here is the useful answer. For velocity-time graphs GCSE maths questions, gradient represents acceleration and the area between the graph and the time axis represents displacement. Most questions are built around those two ideas. Your task is to recognise which one is being tested, choose the correct calculation and show enough working to earn the method marks.
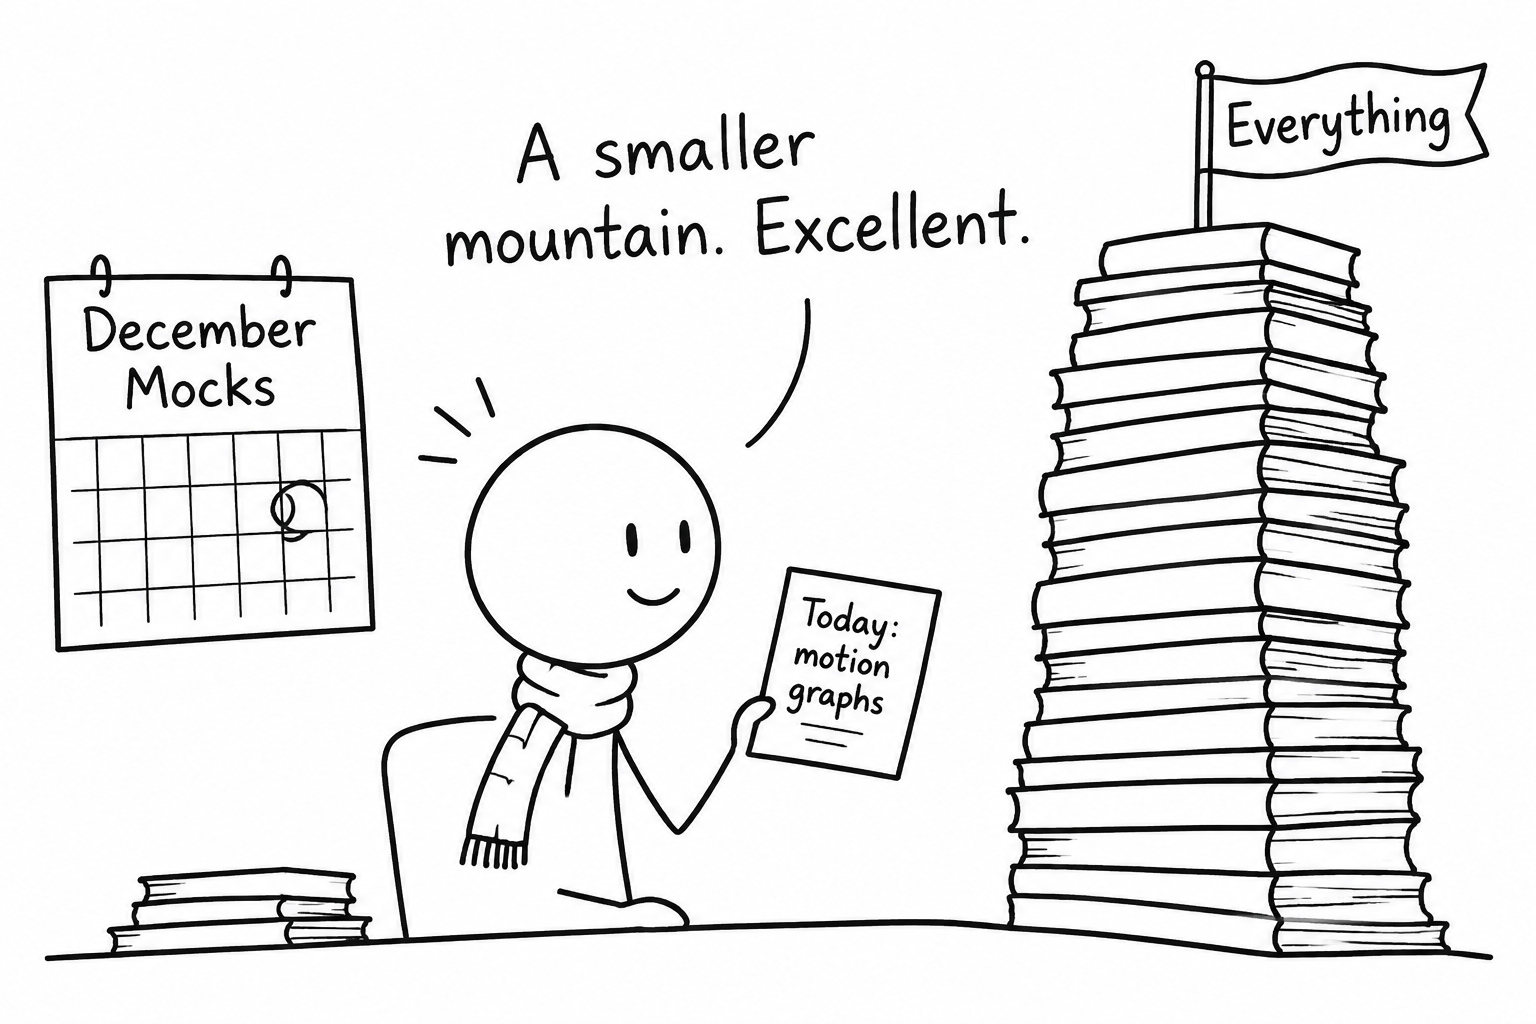 A Year 11 student turns a revision mountain into one manageable topic
Your velocity-time graphs mock revision checklist
Before attempting a full set of questions, make sure you can:
- read velocity and time accurately from the axes
- describe sections with constant, increasing or decreasing velocity
- calculate acceleration using gradient
- calculate displacement using area
- split a compound region into rectangles, triangles and trapezia
- estimate an area beneath a curve using trapezia
- include appropriate units
- distinguish velocity from acceleration
If any item feels uncertain, begin with the velocity-time graphs revision guide. A short lesson before question practice is usually more effective than repeatedly guessing at the same method.
What each part of the graph means
The horizontal axis represents time. The vertical axis represents velocity. That sounds simple, but many mistakes begin with reading one axis as the other.
A horizontal section above the time axis shows constant velocity. It does not show that the object is stationary. The object is stationary only when its velocity is 000.
An upward straight line shows constant positive acceleration. A downward straight line shows constant negative acceleration, sometimes described in exam questions as deceleration. A curved line means the acceleration is changing because the gradient is changing.
If a graph goes below the time axis, the velocity is negative. This indicates motion in the opposite direction. Areas below the axis give negative displacement, so they must be treated carefully when finding net displacement.
Gradient gives acceleration
Acceleration is the change in velocity divided by the change in time:
acceleration=change in velocitychange in time\text{acceleration}=\frac{\text{change in velocity}}{\text{change in time}}acceleration=change in timechange in velocityEquivalently,
a=v−uta=\frac{v-u}{t}a=tv−uwhere uuu is the initial velocity and vvv is the final velocity.
On a straight section, select two clear points and calculate:
gradient=vertical changehorizontal change\text{gradient}=\frac{\text{vertical change}}{\text{horizontal change}}gradient=horizontal changevertical changeIf velocity is measured in metres per second and time in seconds, the acceleration unit is m/s2\text{m/s}^2m/s2.
For a curve, the gradient at one instant is estimated by drawing a tangent. The wider the tangent triangle, provided it follows the tangent accurately, the less effect a small reading error will have.
Area gives displacement
The area between a velocity-time graph and the time axis represents displacement. For straight-edged regions, use familiar area formulae:
rectangle=base×height\text{rectangle}=\text{base}\times\text{height}rectangle=base×height triangle=12×base×height\text{triangle}=\frac{1}{2}\times\text{base}\times\text{height}triangle=21×base×height trapezium=12(a+b)h\text{trapezium}=\frac{1}{2}(a+b)htrapezium=21(a+b)hThe dimensions explain why area gives displacement:
ms×s=m\frac{\text{m}}{\text{s}}\times\text{s}=\text{m}sm×s=mWhen the graph changes shape, draw faint vertical lines to divide the region into manageable pieces. Calculate each area separately, then combine them. This is safer than trying to invent one formula for the entire graph.
Exam-style question: a piecewise linear journey
An object has an initial velocity of 4 m/s4\text{ m/s}4 m/s. Its velocity increases uniformly to 16 m/s16\text{ m/s}16 m/s over 666 seconds. It then travels at 16 m/s16\text{ m/s}16 m/s for 555 seconds before slowing uniformly to rest over 444 seconds.
Find the acceleration during the first 666 seconds.
The change in velocity is:
16−4=12 m/s16-4=12\text{ m/s}16−4=12 m/sTherefore:
a=126=2 m/s2a=\frac{12}{6}=2\text{ m/s}^2a=612=2 m/s2Find the total displacement.
The first region is a trapezium:
12(4+16)×6=60 m\frac{1}{2}(4+16)\times6=60\text{ m}21(4+16)×6=60 mThe constant-velocity section is a rectangle:
16×5=80 m16\times5=80\text{ m}16×5=80 mThe final section is a triangle:
12×4×16=32 m\frac{1}{2}\times4\times16=32\text{ m}21×4×16=32 mAdd the three areas:
60+80+32=172 m60+80+32=172\text{ m}60+80+32=172 mNotice the first region is not a triangle because the object begins at 4 m/s4\text{ m/s}4 m/s rather than 0 m/s0\text{ m/s}0 m/s. That small visual detail changes the answer.
You can consolidate this method with the velocity-time graphs exam booklet, which allows you to work through a sequence rather than relying on one example.
Exam-style question: estimating beneath a curve
A curved velocity-time graph is read at intervals of 222 seconds.
| Time in seconds | Velocity in m/s\text{m/s}m/s |
|---|---|
| 000 | 000 |
| 222 | 555 |
| 444 | 999 |
| 666 | 121212 |
| 888 | 141414 |
Estimate the displacement during the 888 seconds using the trapezium rule.
The strip width is 222. Apply the trapezium rule:
area≈22[0+14+2(5+9+12)]\text{area}\approx\frac{2}{2}\left[0+14+2(5+9+12)\right]area≈22[0+14+2(5+9+12)] area≈14+52=66\text{area}\approx14+52=66area≈14+52=66The estimated displacement is:
66 m66\text{ m}66 mThe approximation sign matters because the original boundary is curved. The trapezia do not follow it exactly.
Calculate the average acceleration from 222 seconds to 888 seconds.
average acceleration=14−58−2\text{average acceleration}=\frac{14-5}{8-2}average acceleration=8−214−5 average acceleration=96=1.5 m/s2\text{average acceleration}=\frac{9}{6}=1.5\text{ m/s}^2average acceleration=69=1.5 m/s2This is an average over an interval, not the instantaneous acceleration at one particular time.
The slips examiners see most
Treating a flat line as stationary
A flat velocity-time graph shows constant velocity. The object is stationary only if that line lies on the time axis.
Using gradient when the question asks for displacement
Underline the requested quantity. Acceleration means gradient; displacement means area. Do not begin calculating until you know which relationship is needed.
Forgetting part of a compound area
A sloping section that begins above the axis often forms a trapezium, not a triangle. Splitting it into a rectangle and triangle is also valid.
Dividing the gradient the wrong way round
Use change in velocity divided by change in time. Writing the formula before substituting values reduces the chance of reversing it.
Ignoring negative areas
For displacement, area below the axis is negative. For total distance travelled, use the magnitude of each region and add the distances. Always check which quantity the question requests.
Dropping units or giving false accuracy
Acceleration and displacement use different units. Carry the units through your calculation, and do not give an estimated answer to an unjustified number of decimal places.
A focused plan before the mock
Start with one revision lesson, then complete a small group of questions without notes. Mark them immediately and record whether each error involved gradient, area, interpretation or arithmetic.
Next, choose questions matched to your exam board. MathsGenie provides AQA velocity-time graph questions, Edexcel velocity-time graph questions and OCR velocity-time graph revision. Worked solutions and mark schemes help you see not only the final answer, but where the marks are earned.
Finish by building a targeted practice paper in the MathsGenie Mock Exam Builder. Select the topics that exposed weaknesses, complete the paper under timed conditions, then use the mark scheme to plan your next revision session. Mock preparation becomes more manageable when it is based on evidence rather than worry.