Trig Graphs GCSE Maths: Mock Revision Guide
Trig graphs GCSE maths revision made clear. Learn key curves, avoid common mistakes and practise two exam-style questions before your Year 11 mock.
December mocks have a habit of making every topic feel urgent at once. A Year 11 student opens a revision list, sees algebra, geometry, probability and trigonometry, then wonders where to begin.
For trig graphs GCSE maths revision, the answer is reassuringly small: learn the shapes and key coordinates of the sine, cosine and tangent graphs, understand their periods, then practise reading and sketching them. You do not need to memorise hundreds of disconnected facts. You need a reliable picture of how each graph behaves.
This guide takes you through that method, including two exam-style questions and the slips that commonly lose marks.
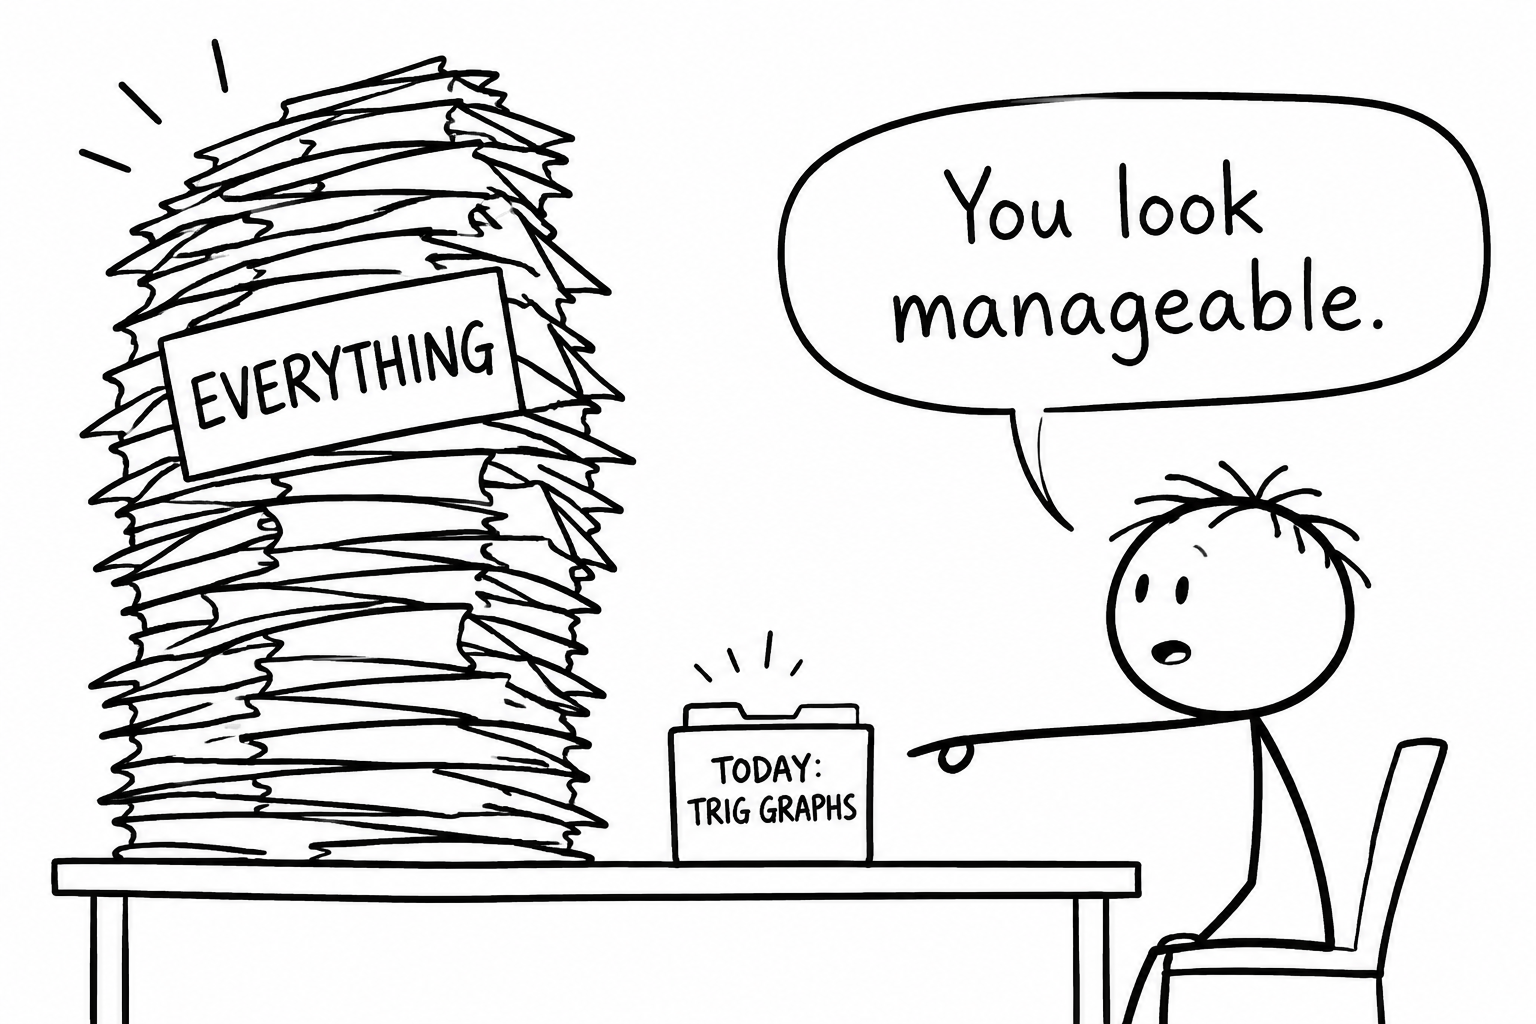 A student choosing one manageable trig graphs folder instead of an enormous pile of revision
Your trig graphs mock revision checklist
Before your mock, make sure you can:
- recognise y=sinxy=\sin xy=sinx, y=cosxy=\cos xy=cosx and y=tanxy=\tan xy=tanx;
- plot their key coordinates in degrees;
- state the period of each graph;
- identify the maximum and minimum values of sine and cosine;
- show the asymptotes of the tangent graph;
- sketch transformed graphs such as y=2cosxy=2\cos xy=2cosx;
- use a graph to solve a trigonometric equation;
- give every solution in the stated interval.
Start with the Trigonometric and Exponential Graphs revision lesson if you follow Edexcel. OCR students can use the corresponding OCR trigonometric graphs revision lesson. Always compare your revision list with your current exam board specification and tier.
Learn the three graph personalities
A useful graph is not just a shape. It is a pattern with landmarks. Once the landmarks are secure, the curve between them becomes much easier to remember.
The sine graph
The sine graph starts at the origin. Between 0∘0^\circ0∘ and 360∘360^\circ360∘, its key coordinates are:
(0∘,0), (90∘,1), (180∘,0), (270∘,−1), (360∘,0)(0^\circ,0),\ (90^\circ,1),\ (180^\circ,0),\ (270^\circ,-1),\ (360^\circ,0)(0∘,0), (90∘,1), (180∘,0), (270∘,−1), (360∘,0)Its maximum value is 111, its minimum value is −1-1−1, and its period is 360∘360^\circ360∘. This means the complete pattern repeats every 360∘360^\circ360∘.
Think of sine as beginning in the middle, rising first, falling through the middle, and then returning.
The cosine graph
Cosine follows the same smooth wave but starts at its maximum. Its key coordinates are:
(0∘,1), (90∘,0), (180∘,−1), (270∘,0), (360∘,1)(0^\circ,1),\ (90^\circ,0),\ (180^\circ,-1),\ (270^\circ,0),\ (360^\circ,1)(0∘,1), (90∘,0), (180∘,−1), (270∘,0), (360∘,1)It also has a maximum of 111, a minimum of −1-1−1, and a period of 360∘360^\circ360∘.
The simplest memory cue is that sine starts at 000, while cosine starts at 111.
The tangent graph
Tangent behaves differently. It has a period of 180∘180^\circ180∘, crosses the horizontal axis at multiples of 180∘180^\circ180∘, and is undefined at:
x=90∘+180∘nx=90^\circ+180^\circ nx=90∘+180∘nwhere nnn is an integer. These undefined values are shown using vertical dashed asymptotes. From 0∘0^\circ0∘ to 360∘360^\circ360∘, the principal asymptotes are at 90∘90^\circ90∘ and 270∘270^\circ270∘.
Unlike sine and cosine, tangent has no maximum or minimum. Its branches keep increasing as they approach each asymptote.
Turn memory into a quick sketching method
When asked to sketch a trig graph, resist the temptation to draw the curve immediately. A smooth but misplaced wave earns less than a carefully constructed one.
Use this sequence:
- Check the stated interval and axis scale.
- Mark the important angles.
- Plot the exact key coordinates.
- Add any asymptotes using dashed vertical lines.
- Join the coordinates with the correct smooth curve.
- Check the starting value, finishing value and period.
For sine and cosine, divide each cycle into four equal sections. For tangent, locate the asymptotes first. That single habit prevents many incorrect branches.
It also helps to revise the exact trig values lesson, because values such as sin30∘\sin 30^\circsin30∘ and cos60∘\cos 60^\circcos60∘ often support trig graph questions.
Worked exam-style question: sketching a transformed graph
Question: Sketch y=2cosxy=2\cos xy=2cosx for 0∘≤x≤360∘0^\circ\le x\le360^\circ0∘≤x≤360∘.
The ordinary cosine graph has outputs 111, 000, −1-1−1, 000 and 111 at the five main angles. Multiplying by 222 doubles every output:
2cos0∘=2,2cos90∘=0,2cos180∘=−2,2cos270∘=0,2cos360∘=2.\begin{aligned} 2\cos 0^\circ&=2,\\ 2\cos 90^\circ&=0,\\ 2\cos 180^\circ&=-2,\\ 2\cos 270^\circ&=0,\\ 2\cos 360^\circ&=2. \end{aligned}2cos0∘2cos90∘2cos180∘2cos270∘2cos360∘=2,=0,=−2,=0,=2.Plot:
(0∘,2), (90∘,0), (180∘,−2), (270∘,0), (360∘,2)(0^\circ,2),\ (90^\circ,0),\ (180^\circ,-2),\ (270^\circ,0),\ (360^\circ,2)(0∘,2), (90∘,0), (180∘,−2), (270∘,0), (360∘,2)Then join them with a smooth cosine curve.
The multiplier changes the vertical size, or amplitude, but not the period. The graph still completes one cycle every 360∘360^\circ360∘. Its maximum is now 222 and its minimum is −2-2−2.
In general, the amplitude of y=asinxy=a\sin xy=asinx or y=acosxy=a\cos xy=acosx is ∣a∣|a|∣a∣.
Worked exam-style question: solving from the graph
Question: Solve
sinx=−12\sin x=-\frac{1}{2}sinx=−21for 0∘≤x≤360∘0^\circ\le x\le360^\circ0∘≤x≤360∘.
First find the reference angle. Since
sin30∘=12,\sin 30^\circ=\frac{1}{2},sin30∘=21,the reference angle is 30∘30^\circ30∘.
The sine graph is below the horizontal axis between 180∘180^\circ180∘ and 360∘360^\circ360∘. The two relevant positions are therefore:
x=180∘+30∘=210∘x=180^\circ+30^\circ=210^\circx=180∘+30∘=210∘and
x=360∘−30∘=330∘.x=360^\circ-30^\circ=330^\circ.x=360∘−30∘=330∘.So the complete answer is:
x=210∘ or x=330∘\boxed{x=210^\circ\text{ or }x=330^\circ}x=210∘ or x=330∘The important word is complete. Trigonometric equations often have more than one solution in an interval. On a graph, you are looking for every point where the curve meets the horizontal line y=−12y=-\frac{1}{2}y=−21.
How transformations affect trig graphs
For graphs such as y=asinbxy=a\sin bxy=asinbx and y=acosbxy=a\cos bxy=acosbx:
amplitude=∣a∣\text{amplitude}=|a|amplitude=∣a∣and
period=360∘∣b∣.\text{period}=\frac{360^\circ}{|b|}.period=∣b∣360∘.For y=atanbxy=a\tan bxy=atanbx, the period is:
period=180∘∣b∣.\text{period}=\frac{180^\circ}{|b|}.period=∣b∣180∘.Do not confuse y=2sinxy=2\sin xy=2sinx with y=sin2xy=\sin 2xy=sin2x. The first doubles the outputs and changes the amplitude. The second completes its cycles twice as quickly and changes the period to 180∘180^\circ180∘.
Slips examiners often see
Mixing up sine and cosine
If your graph begins at the wrong height, every later coordinate may also be wrong. Remember:
sin0∘=0,cos0∘=1.\sin 0^\circ=0,\qquad \cos 0^\circ=1.sin0∘=0,cos0∘=1.Using radians instead of degrees
GCSE questions normally present these graph angles in degrees. Check that your calculator is in degree mode when using it to support your work.
Drawing tangent as one continuous curve
The tangent graph must break at each asymptote. Never join branches across an undefined value.
Forgetting a second solution
A calculator may display one angle, but the graph can show another solution in the interval. Sketch the relevant cycle and inspect every intersection.
Changing the wrong feature
A number outside the trigonometric function changes the vertical scale. A number multiplying xxx inside the function changes the period.
Drawing through points freehand without plotting
Memory becomes unreliable under mock pressure. Plot the landmarks first and curve second.
A focused plan before your December mock
Spend one short session rebuilding the three standard graphs from memory. In the next session, practise transformations and equations. Finally, complete mixed trig graphs exam questions under timed conditions and check each answer against the mark scheme.
The Edexcel GCSE Maths revision hub brings together topic lessons, worksheets, past papers and mark schemes. Across MathsGenie, you can also use video solutions, practice questions, mini tests, predicted papers and the revision planner to turn a weak topic into a specific plan.
When the basic shapes feel secure, use the GCSE Mock Exam Builder to build a targeted practice paper containing the topics you need. Sit it without notes, mark it honestly, then return to the exact mistake rather than revising everything again.
That is often how confidence grows. Not from trying to master the whole specification in one evening, but from choosing one uncertain graph, plotting the first correct coordinate, and continuing from there.