Cumulative Frequency GCSE Maths Mock Revision
Cumulative frequency GCSE maths made clear. Learn the graph method, practise two mock-style questions and avoid common quartile mistakes.
December mocks have a habit of feeling distant until they suddenly do not. For a Year 11 student, cumulative frequency can be one of those topics that looks familiar on a revision list but becomes less certain when a blank grid appears.
The central idea is simple. In cumulative frequency GCSE maths, you keep a running total, plot each total against the upper class boundary, and use the resulting curve to estimate medians, quartiles and other values. Because readings come from a graph, answers are usually estimates.
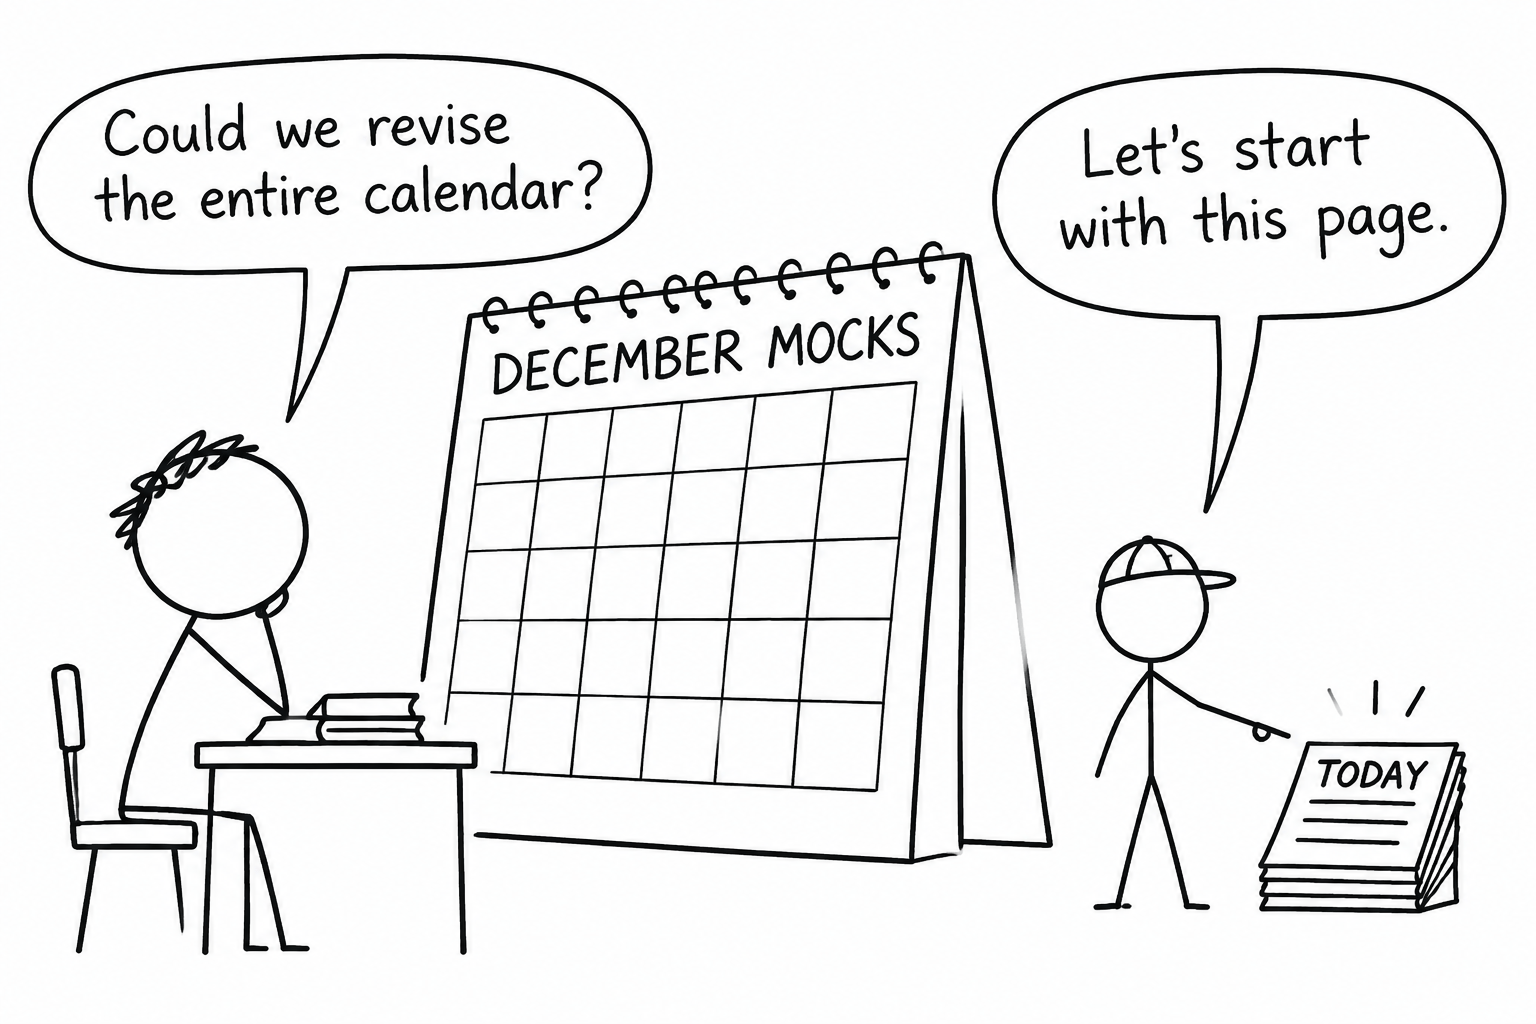 A Year 11 student tries to revise the whole December mock calendar at once
Your cumulative frequency mock revision checklist
Before attempting cumulative frequency exam questions, make sure you can:
- calculate running totals from a grouped frequency table;
- plot cumulative frequency against upper class boundaries;
- include a starting point with cumulative frequency 000 when appropriate;
- draw a smooth increasing curve;
- locate the median at n2\frac{n}{2}2n;
- locate the lower and upper quartiles at n4\frac{n}{4}4n and 3n4\frac{3n}{4}43n;
- calculate the interquartile range using Q3−Q1Q_3-Q_1Q3−Q1;
- find a class frequency by subtracting cumulative totals.
Begin with the free GCSE maths revision resources, then use GCSE exam papers to see how the topic is presented in complete papers.
How to draw a cumulative frequency graph
Suppose a table records time in grouped intervals. The ordinary frequency tells you how many results lie in each interval. Cumulative frequency tells you how many results lie at or below each upper boundary.
If the frequencies are 444, 999, 151515, 888 and 444, the cumulative frequencies are:
4,4+9=13,13+15=28,28+8=36,36+4=404,\quad 4+9=13,\quad 13+15=28,\quad 28+8=36,\quad 36+4=404,4+9=13,13+15=28,28+8=36,36+4=40The final cumulative frequency must equal the total frequency. That is a useful check which takes only a few seconds.
Plot each cumulative total against the upper end of its interval. For 10<t≤2010<t\leq2010<t≤20, for example, the point uses 202020, not 101010 and not the midpoint 151515. Join the points with a smooth curve rather than a series of sharp line segments, unless the question gives different instructions.
Exam-style question: drawing the curve and finding quartiles
Forty students complete a task. Their times are shown below.
| Time, ttt minutes | Frequency | Cumulative frequency |
|---|---|---|
| 0<t≤100<t\leq100<t≤10 | 444 | 444 |
| 10<t≤2010<t\leq2010<t≤20 | 999 | 131313 |
| 20<t≤3020<t\leq3020<t≤30 | 151515 | 282828 |
| 30<t≤4030<t\leq4030<t≤40 | 888 | 363636 |
| 40<t≤5040<t\leq5040<t≤50 | 444 | 404040 |
Plot these points:
(0,0), (10,4), (20,13), (30,28), (40,36), (50,40)(0,0),\ (10,4),\ (20,13),\ (30,28),\ (40,36),\ (50,40)(0,0), (10,4), (20,13), (30,28), (40,36), (50,40)Draw a smooth increasing curve through them.
Estimate the median
There are 404040 students, so the median is at cumulative frequency:
402=20\frac{40}{2}=20240=20Draw horizontally from 202020 on the cumulative frequency axis to the curve, then vertically down to the time axis. A carefully drawn graph should give an estimate of about 252525 minutes.
Estimate the interquartile range
The lower quartile is at:
Q1:404=10Q_1:\quad \frac{40}{4}=10Q1:440=10The upper quartile is at:
Q3:3×404=30Q_3:\quad \frac{3\times40}{4}=30Q3:43×40=30Reasonable readings from the curve are approximately 171717 minutes and 333333 minutes. Therefore:
interquartile range=Q3−Q1≈33−17=16\text{interquartile range}=Q_3-Q_1\approx33-17=16interquartile range=Q3−Q1≈33−17=16Your result may differ slightly because the curve and readings are estimates. In an examination, leave construction lines visible so the examiner can follow your method.
Exam-style question: working backwards from totals
A cumulative frequency table summarises the distances completed by 606060 runners.
| Distance, ddd km | Cumulative frequency |
|---|---|
| d≤20d\leq20d≤20 | 333 |
| d≤35d\leq35d≤35 | 141414 |
| d≤50d\leq50d≤50 | 303030 |
| d≤65d\leq65d≤65 | 464646 |
| d≤80d\leq80d≤80 | 606060 |
Find the frequency in 35<d≤5035<d\leq5035<d≤50
The cumulative frequency up to 505050 km is 303030. The cumulative frequency up to 353535 km is 141414. Subtract them:
30−14=1630-14=1630−14=16So 161616 runners completed more than 353535 km and no more than 505050 km.
Estimate the distance at the 757575th percentile
The 757575th percentile is at cumulative frequency:
0.75×60=450.75\times60=450.75×60=45On a cumulative frequency graph, you would read across from 454545 and then down to the distance axis. The reading lies just below 656565 km, at approximately 646464 km.
The important distinction is that a percentile gives a position first. You then use the curve to estimate the corresponding measurement.
What the graph is really showing
A cumulative frequency curve answers questions of the form, “How many observations are no greater than this value?” It never falls because a running total cannot decrease.
This perspective makes unfamiliar questions easier. To estimate how many observations are greater than a value, read the cumulative frequency at that value and subtract it from the total. If a graph shows that 313131 of 505050 observations are at or below a particular value, then the number above it is:
50−31=1950-31=1950−31=19That small shift in language, from “at or below” to “above”, is where many marks are won or lost.
Common slips examiners see
Plotting against class midpoints
Cumulative frequency points belong at upper class boundaries. Midpoints are used for other grouped-data methods, including estimating a mean, but not for a cumulative frequency curve.
Using individual frequencies as coordinates
Calculate the running totals before plotting. The final plotted height should equal the total number of observations.
Putting quartiles on the wrong axis
Start with n4\frac{n}{4}4n, n2\frac{n}{2}2n or 3n4\frac{3n}{4}43n on the cumulative frequency axis. Move across to the curve and then down to the measurement axis.
Giving the upper quartile instead of the interquartile range
The interquartile range is not Q3Q_3Q3. It is:
IQR=Q3−Q1\operatorname{IQR}=Q_3-Q_1IQR=Q3−Q1Expecting an exact answer from a curve
A cumulative frequency graph produces estimates. Use a ruler, show construction lines and give sensible accuracy. Do not add unnecessary decimal places to a reading from a hand-drawn graph.
Turn recognition into reliable marks
Reading the method once creates familiarity. Completing questions without notes creates recall. Before your December mock, practise drawing one curve, finding one set of quartiles and answering one backwards question involving subtraction.
Then move into mixed-paper practice. MathsGenie provides free revision lessons, practice questions, mark schemes, video solutions, mini tests and predicted GCSE papers. Use the MathsGenie revision planner to keep cumulative frequency alongside the other topics you need to revisit.
When you are ready, build a targeted practice paper in the Mock Exam Builder. Choose cumulative frequency and the topics around it, complete the paper under timed conditions, and use the mark scheme to decide what to practise next. A mock becomes less intimidating when it is no longer one large event, but a series of small methods you have already rehearsed.