2 Statistics
123456789101112131415161718192021222324252627282930313233343536373839404142434445464748495051525354555657585960616263646566676869707172737475767778798081828384858687888990919293949596979899100101102103104105106107108109110111112113114115116117118119120121122123124125126127128129130131132133134135136137138139140141142143144145146147148149150151152153154155156157158159160161162163164165166167168169170171172173174175176177178179180181182183184185186187188189190191192193194195196197198199200201202203204205206207208209210211212213214215216217218219220221222223224225226227228229230231232233234235236237238239240241242243244245246247248249250251252253254255256257258259260261262263264265266267268269270271272273274275276277278279280281282283284285286287288289290291292293294295296297298299300301302303304305306307308309310311312313314315316317318319320321322323324325326327328329330331332333334335336337338339340341342343344345346347348349350351352353354355356357358359360361362363364365366367368369370371372373374375376377378379380381382383384385386387388389390391392393394395396397398399400401402403404405406407408409410411412413414415416417418419420421422423424425426427428429430431432433434435436437438439440441442443444445446447448449450451452453454455456457458459460461462463464465466467468469470471472473474475476477478479480481482483484485486487488489490491492493494495496497498499500501502503504505506507508509510511
Question 355
A materials engineer records the length, x x\,x metres, and the mass, y y\,y kg, of each rod in a random sample of 40 rods. The sample contains rods made from two different materials.
The scatter diagram below shows her data.
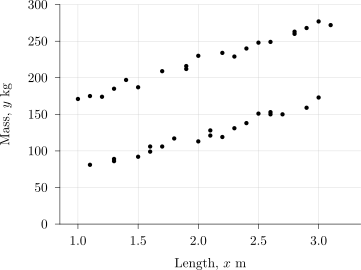
The product moment correlation coefficient for all 40 rods is 0.51.
a.[1]
The researcher's scatter diagram contains two distinct sections. State what feature of the diagram shows this.
b.[1]
Suggest what distinguishes the two sections.
c.[2]
Explain why fitting a single regression line of y y\,y on x x\,x to all 40 rods would be misleading.
d.[2]
The engineer separates the data by material and finds that the correlation coefficient within each material is greater than 0.51. Explain why this is consistent with the scatter diagram.