The diagrams represent a perfectly competitive industry and an individual firm within that industry. Initially, both the market and the firm are in long-run equilibrium.
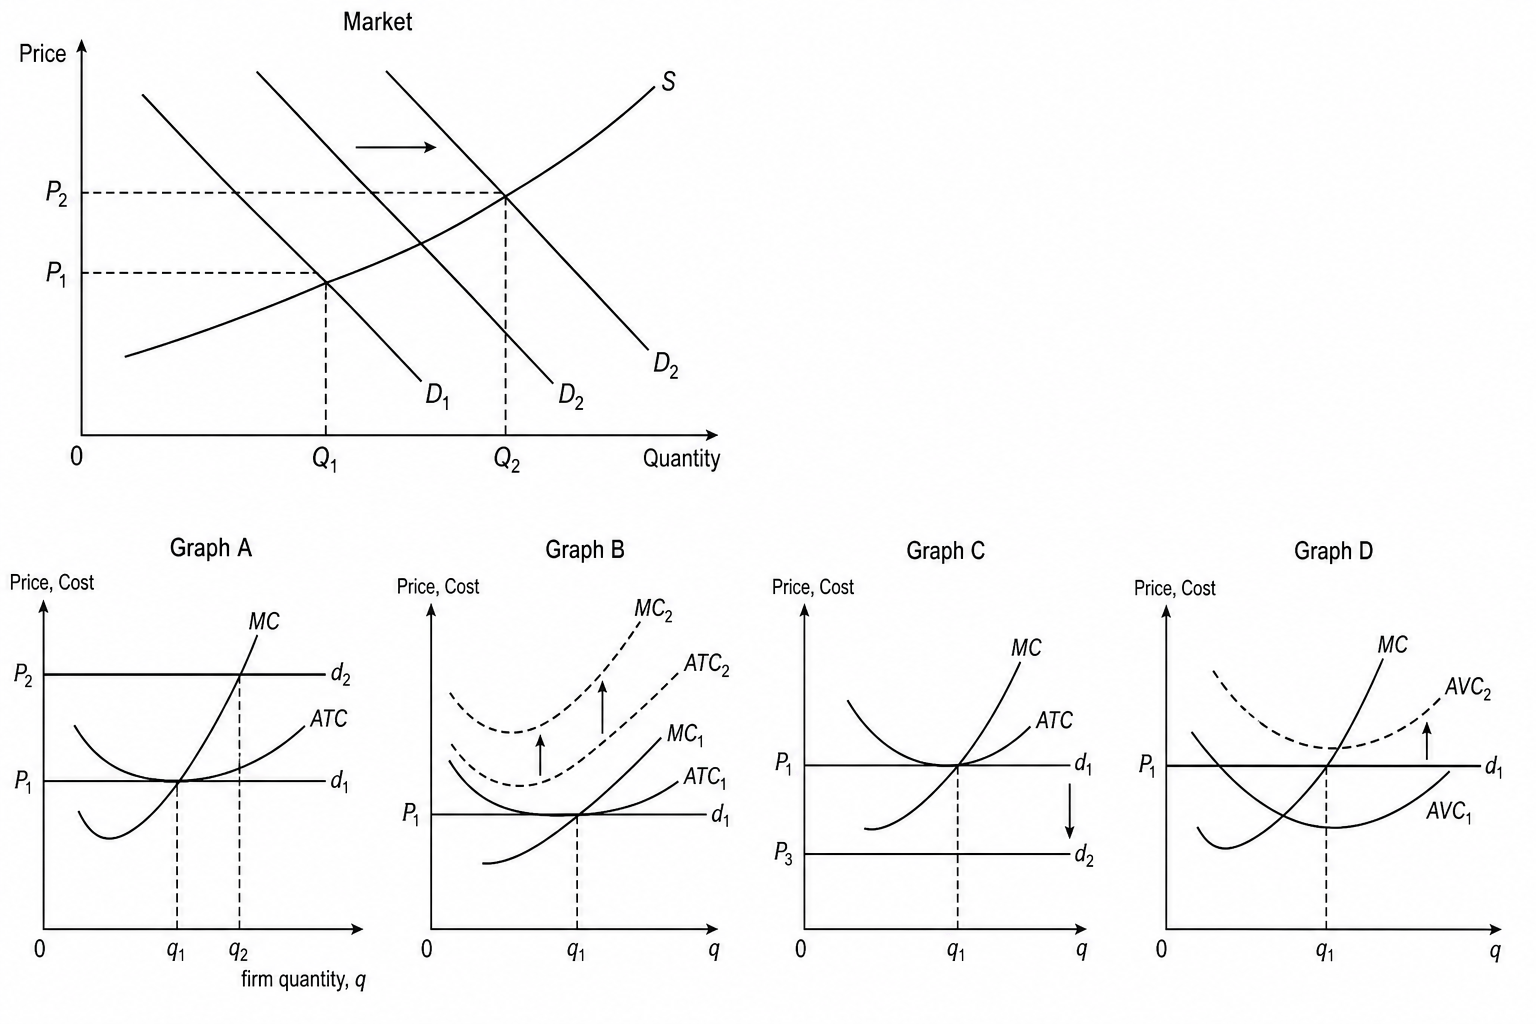
Which of the firm-level graphs (A, B, C, or D) correctly illustrates the short-run response of an individual profit-maximising firm to the market shift shown in the Market Diagram?
Graph A
Graph B
Graph C
Graph D

