Which of the diagrams below illustrates the most likely long-run macroeconomic impact on a host country's economy of a significant tightening of its immigration policies that leads to a net outflow of skilled workers?
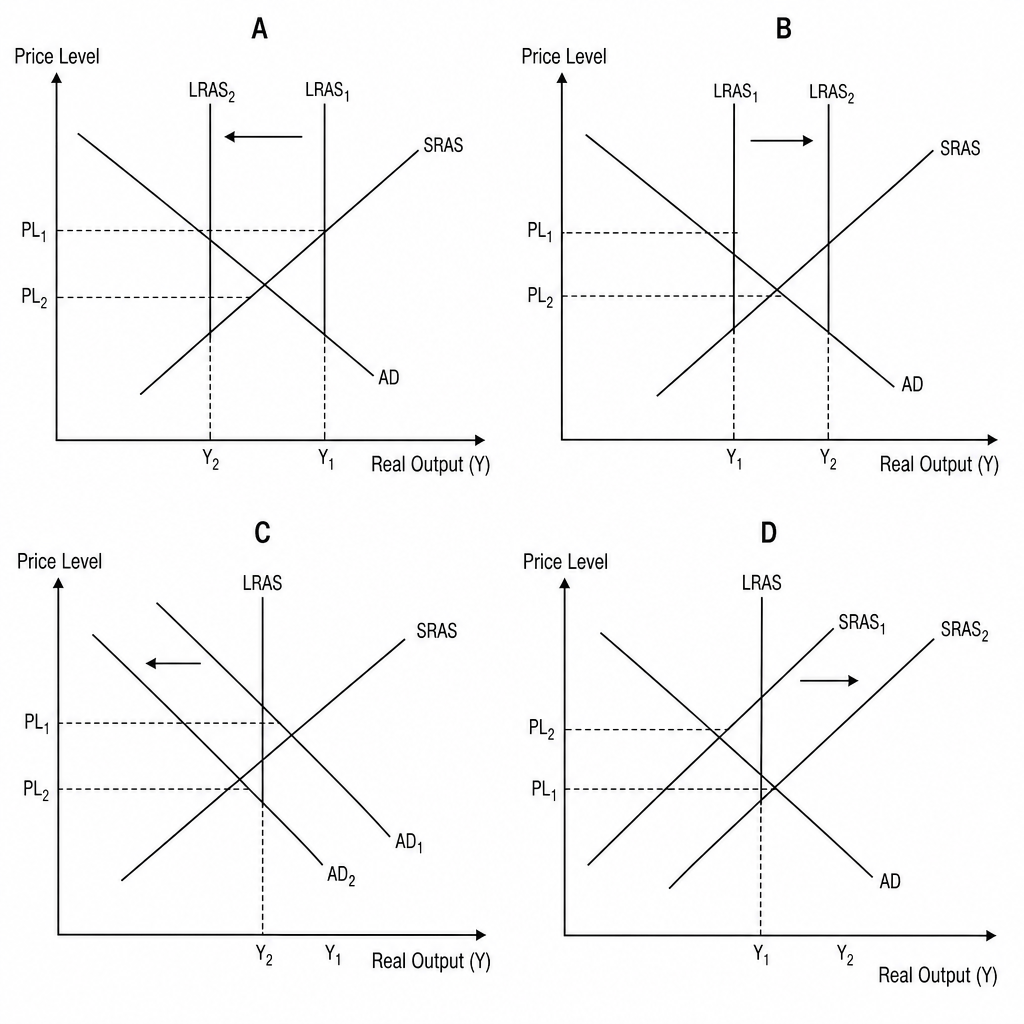
Diagram A
Diagram B
Diagram C
Diagram D