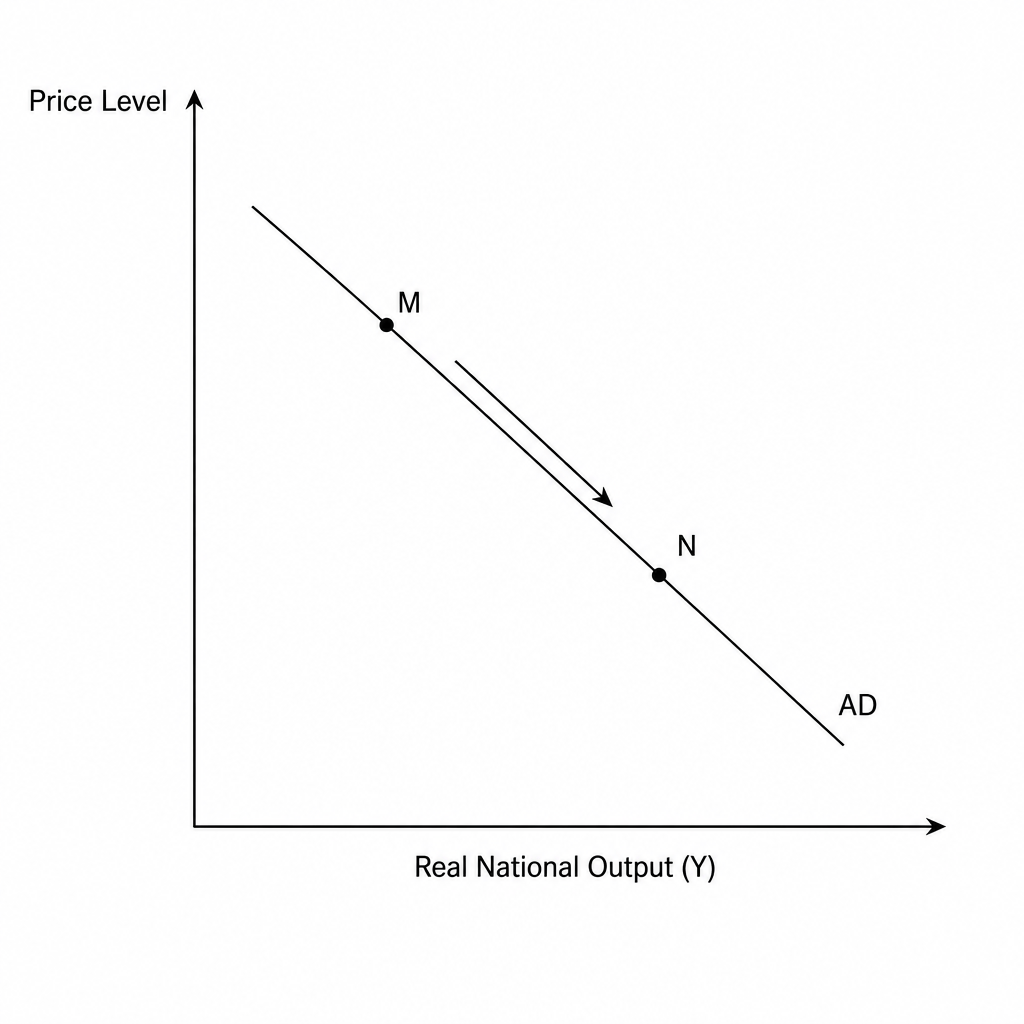
Which of the following would explain the movement from M M\,M to N N\,N along the aggregate demand (ADADAD) curve shown in the diagram below?
A depreciation of the exchange rate that increases the price competitiveness of domestic exports
A reduction in the central bank's base interest rate to encourage consumer borrowing
An increase in the real purchasing power of fixed-value cash and financial assets
A rise in business confidence regarding future profitability and demand