The diagram below shows a shift in an economy's short-run aggregate supply curve from SRAS1\text{SRAS}_1SRAS1 to SRAS2\text{SRAS}_2SRAS2, while its long-run aggregate supply (LRAS\text{LRAS}LRAS) curve remains unchanged.
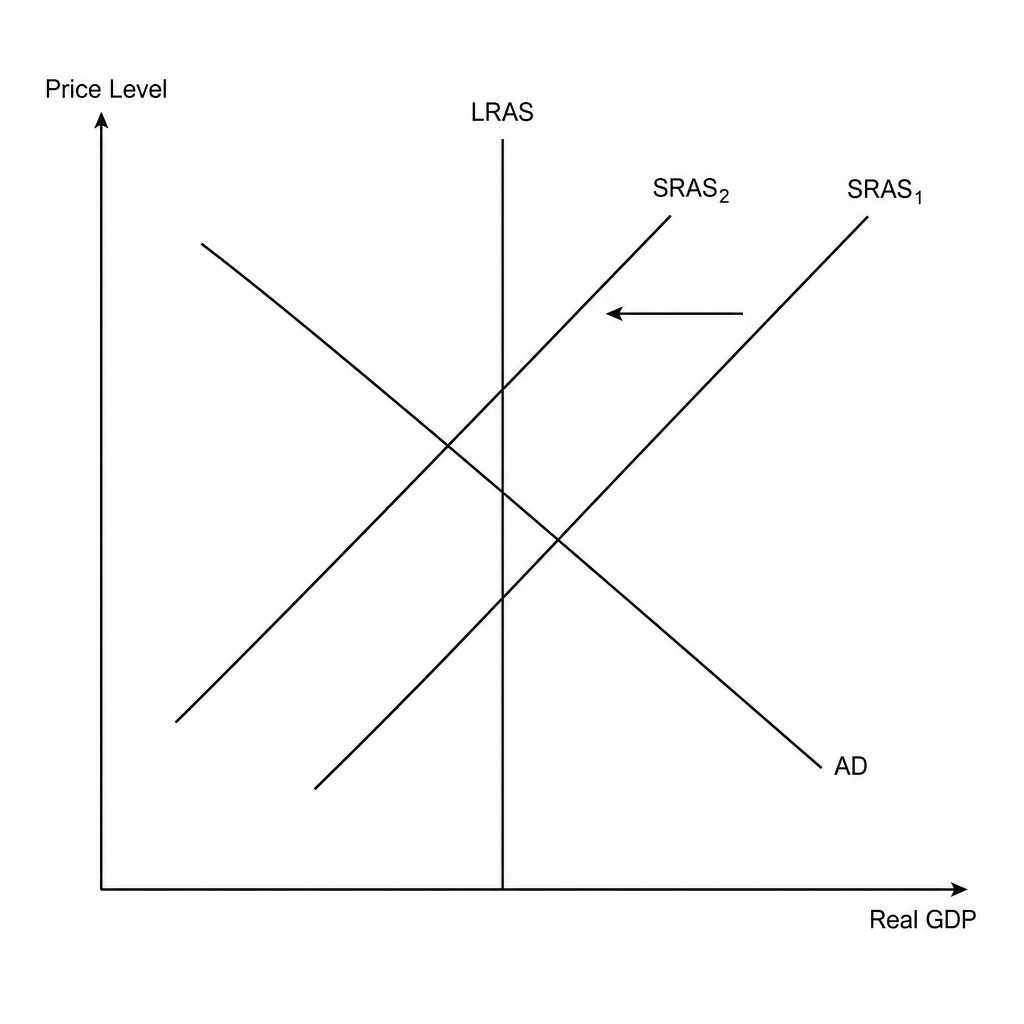
Which of the following events is most likely to have caused this shift?
A general rise in the level of world commodity prices
A sustained increase in net inward migration of working-age population
An increase in state funding for industrial employee apprenticeship schemes
A reduction in the main rate of value-added tax (VAT)