The diagram below shows a shift in an economy's long-run aggregate supply curve from LRAS1\text{LRAS}_1LRAS1 to LRAS2\text{LRAS}_2LRAS2.
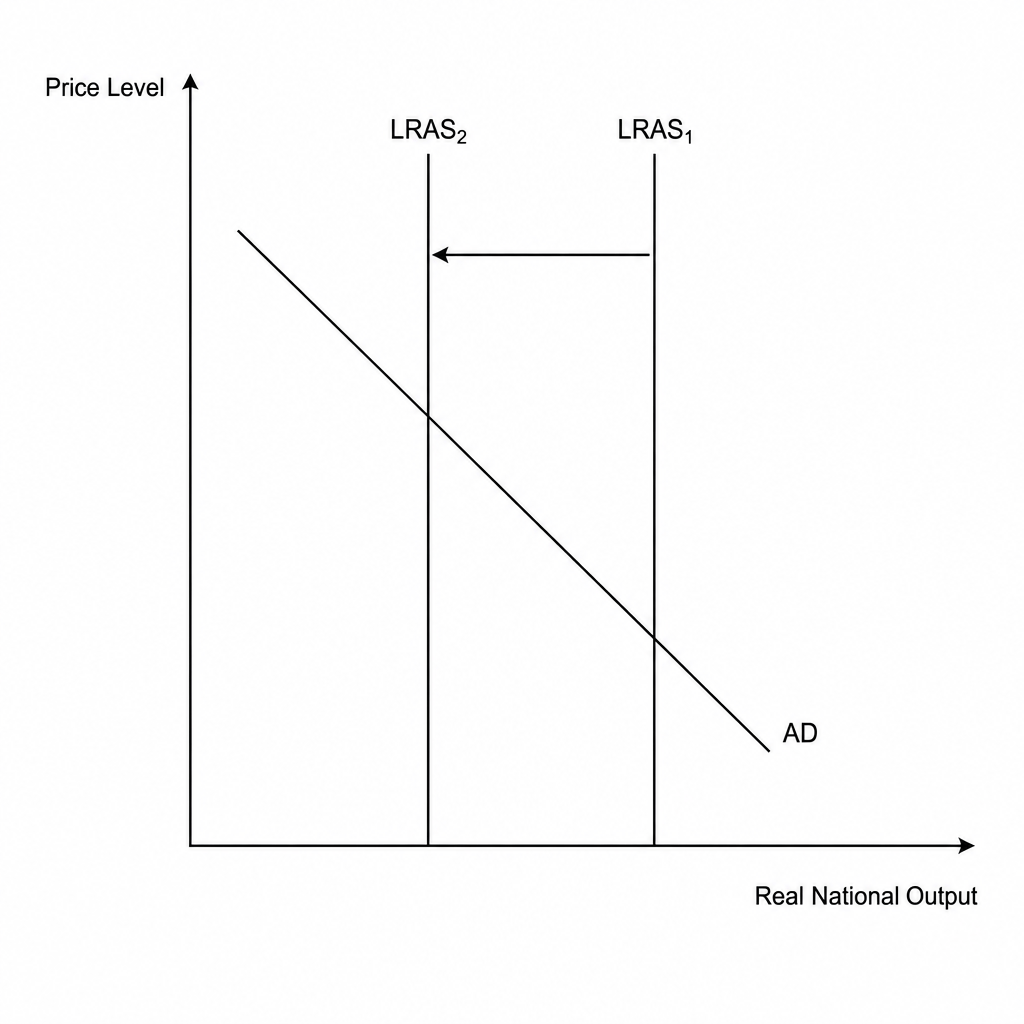
Which of the following is most likely to represent or cause this shift?
A permanent decrease in the economy's productive capacity
A temporary increase in the prices of imported raw materials
A cyclical decline in actual national output due to lower aggregate demand
An increase in the level of spare capacity within the economy