Aggregate demand and aggregate supply

EasyMediumHard
12345678910111213141516171819202122232425262728293031323334353637383940414243444546474849505152535455565758596061
Question 40
Easy

What explains a movement from P P\,P to Q Q\,Q in the diagram below?
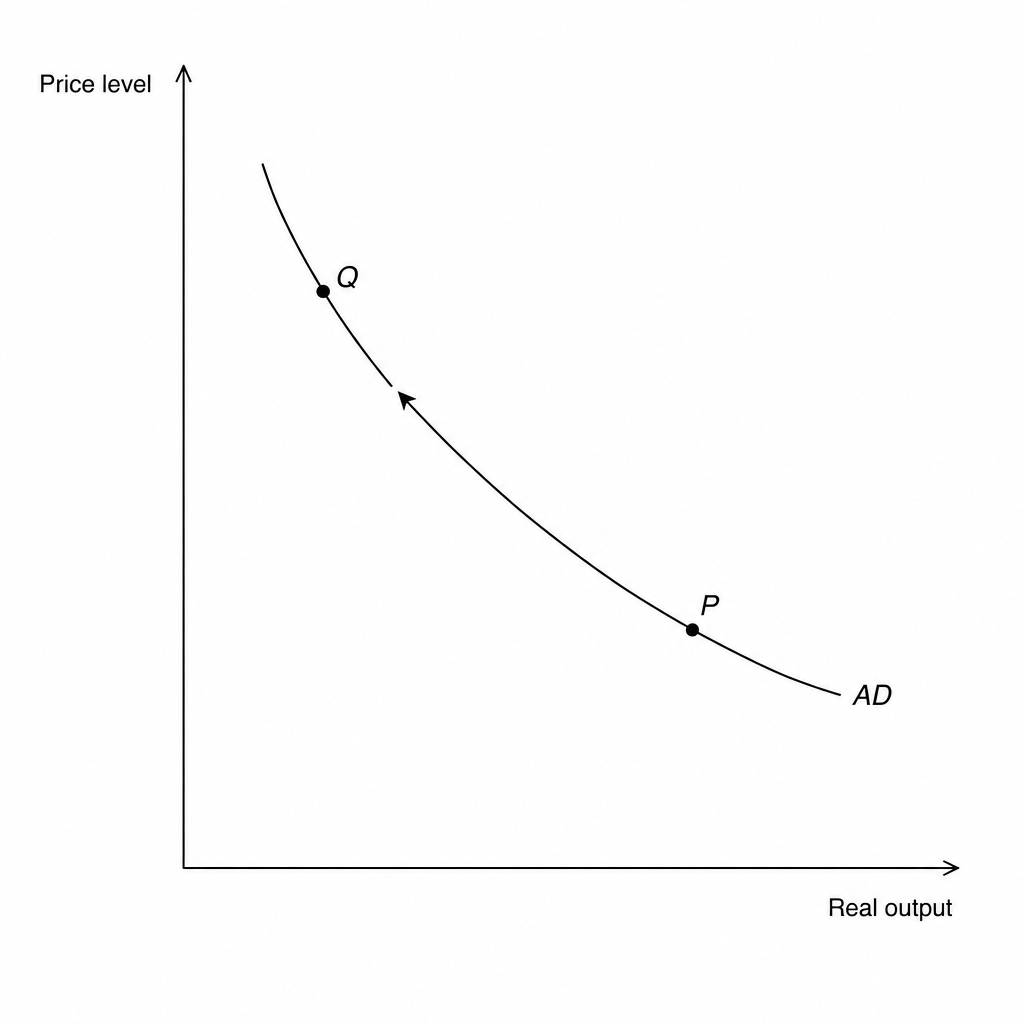
Aggregate demand curve movement

An increase in state investment in infrastructure

A reduction in the real purchasing power of cash holdings

An improvement in business confidence

A reduction in the basic rate of income tax

Aggregate demand and aggregate supply Questions

  1. A Level
  2. /Economics
  3. /Aggregate demand and aggregate supply