An electrocardiogram (ECG) records the electrical activity of the heart over time. The grid on veterinary ECG recordings is calibrated such that 5 large grid squares correspond to exactly 1.0 s1.0\text{ s}1.0 s (meaning each large square represents 0.2 s0.2\text{ s}0.2 s).
The diagram below shows the resting ECG traces of three different mammals:
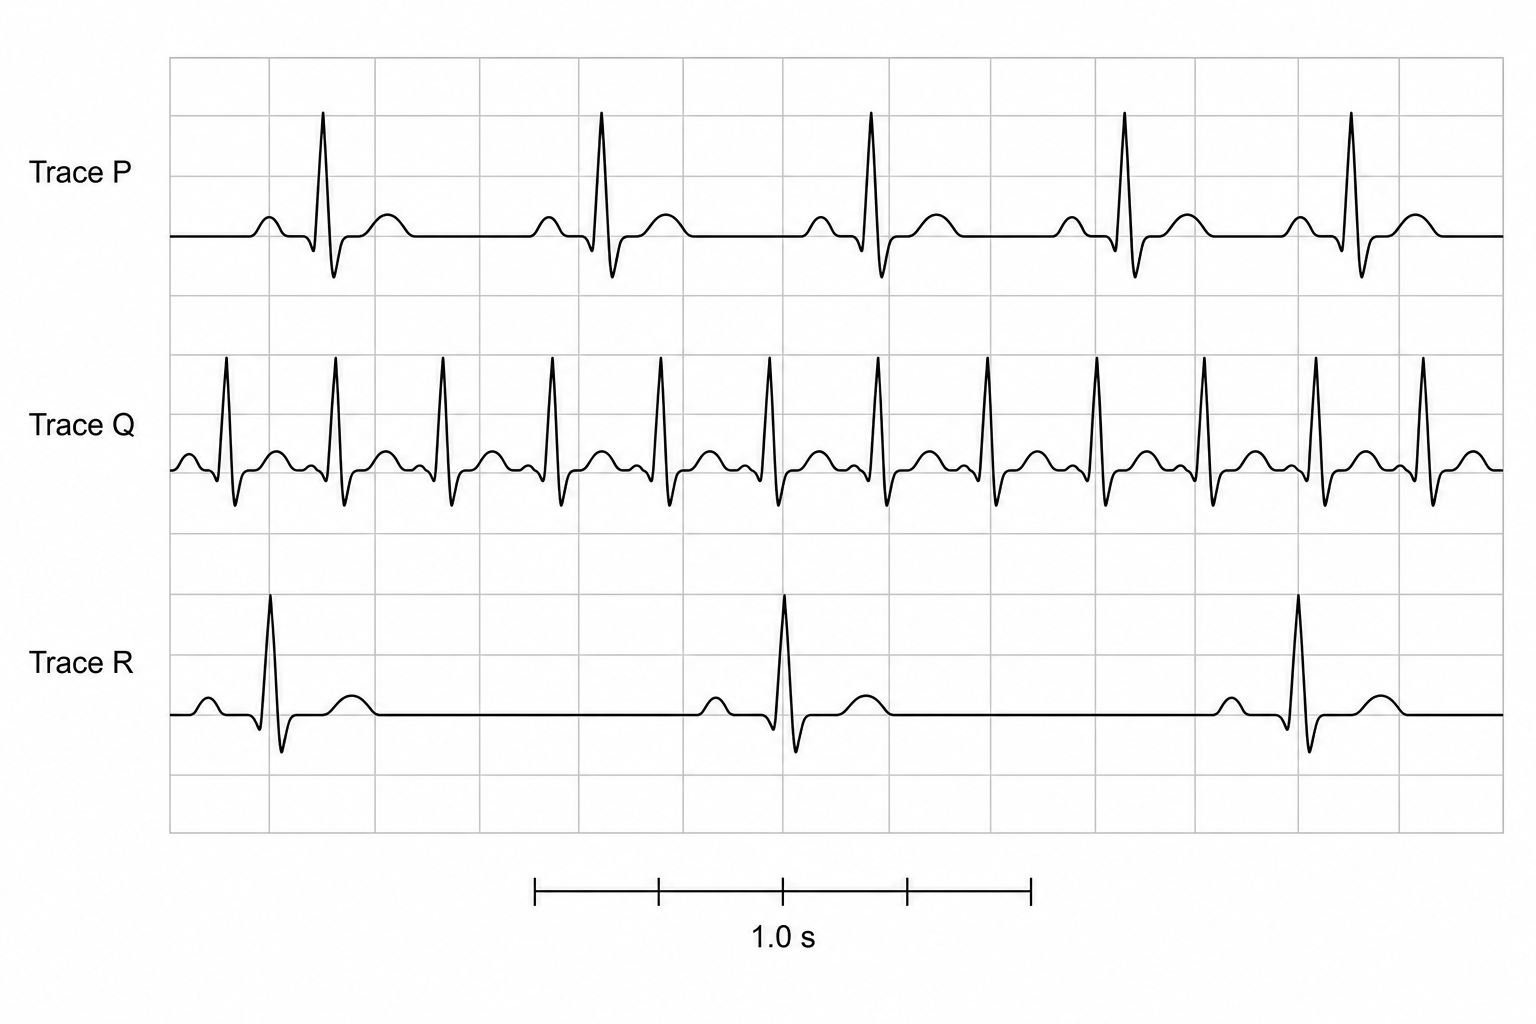
Calculate the heart rate in beats per minute (bpm) for: (i) Trace P (ii) Trace Q
Identify which mammal (A, B, or C) corresponds to:
Explain how the heart of the Thoroughbred horse (Mammal C) adaptively maintains an adequate resting cardiac output to meet the oxygen demands of its large body mass, despite such a low resting heart rate.

