Skip to content
MathsGenie logo
Open app

Course home

  1. A Level
  2. Biology OCR A
  3. Question bank

Transport in animals

EasyMediumHard
123456789101112131415161718192021222324252627282930313233
Question 22

Changes to the heart and circulatory system occur in response to prolonged aerobic training. The graphs in the figure show the changes in resting stroke volume and resting heart rate of a group of elite athletes during a 12-week high-altitude training program.
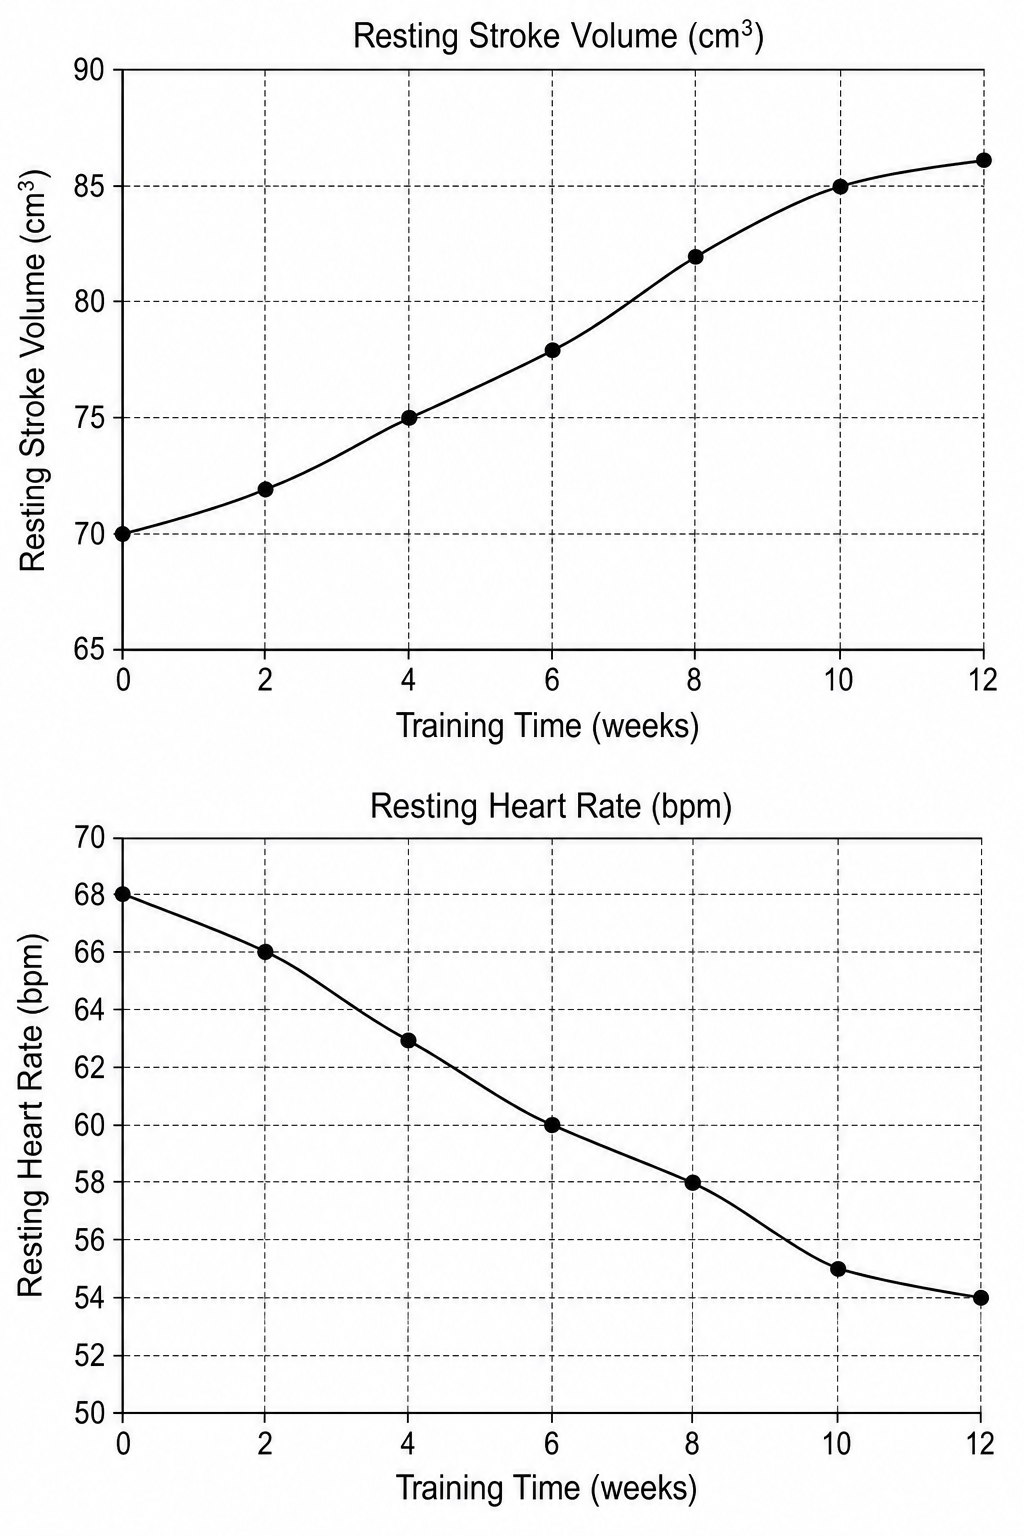
Two line graphs showing cardiovascular changes during a 12-week high-altitude training program. Top graph: Resting Stroke Volume (cm³) vs Training Time (weeks). Bottom graph: Resting Heart Rate (bpm) vs Training Time (weeks).

a.

Use the data in the figure to calculate the resting cardiac output in week 6. Include appropriate units.

[3]
b.

Suggest an advantage of these physiological changes during a high-intensity race.

[2]

Transport in animals Questions

  1. A Level
  2. /Biology
  3. /Transport in animals
