The graph below shows pressure changes in the left side of a mammalian heart during a cardiac cycle.
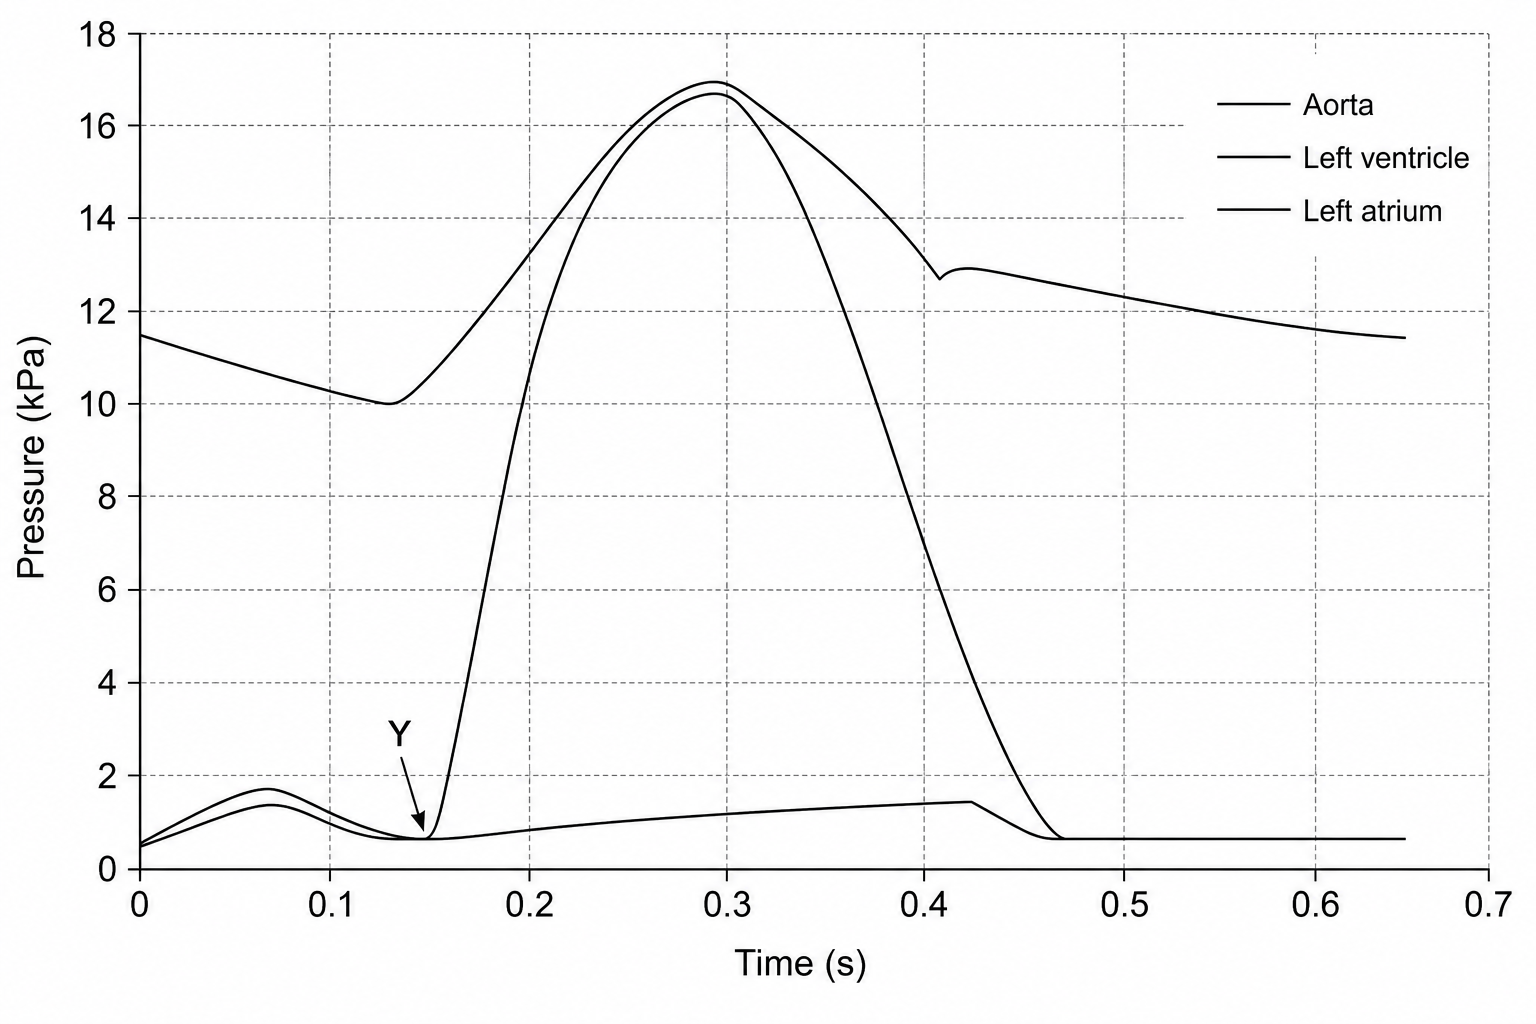
Compare the changes in pressure in the left ventricle with the changes in pressure in the left atrium.
Using the graph, calculate the heart rate of this individual in beats per minute (bpm). Give your answer to 2 significant figures.
Calculate the percentage increase between the minimum and maximum pressure in the aorta. Give your answer to 2 significant figures.
Name the valve which closes at point Y.

