Skip to content
MathsGenie logo
Open app

Course home

  1. A Level
  2. Biology OCR A
  3. Question bank

Transport in animals

EasyMediumHard
123456789101112131415161718192021222324252627282930313233
Question 12

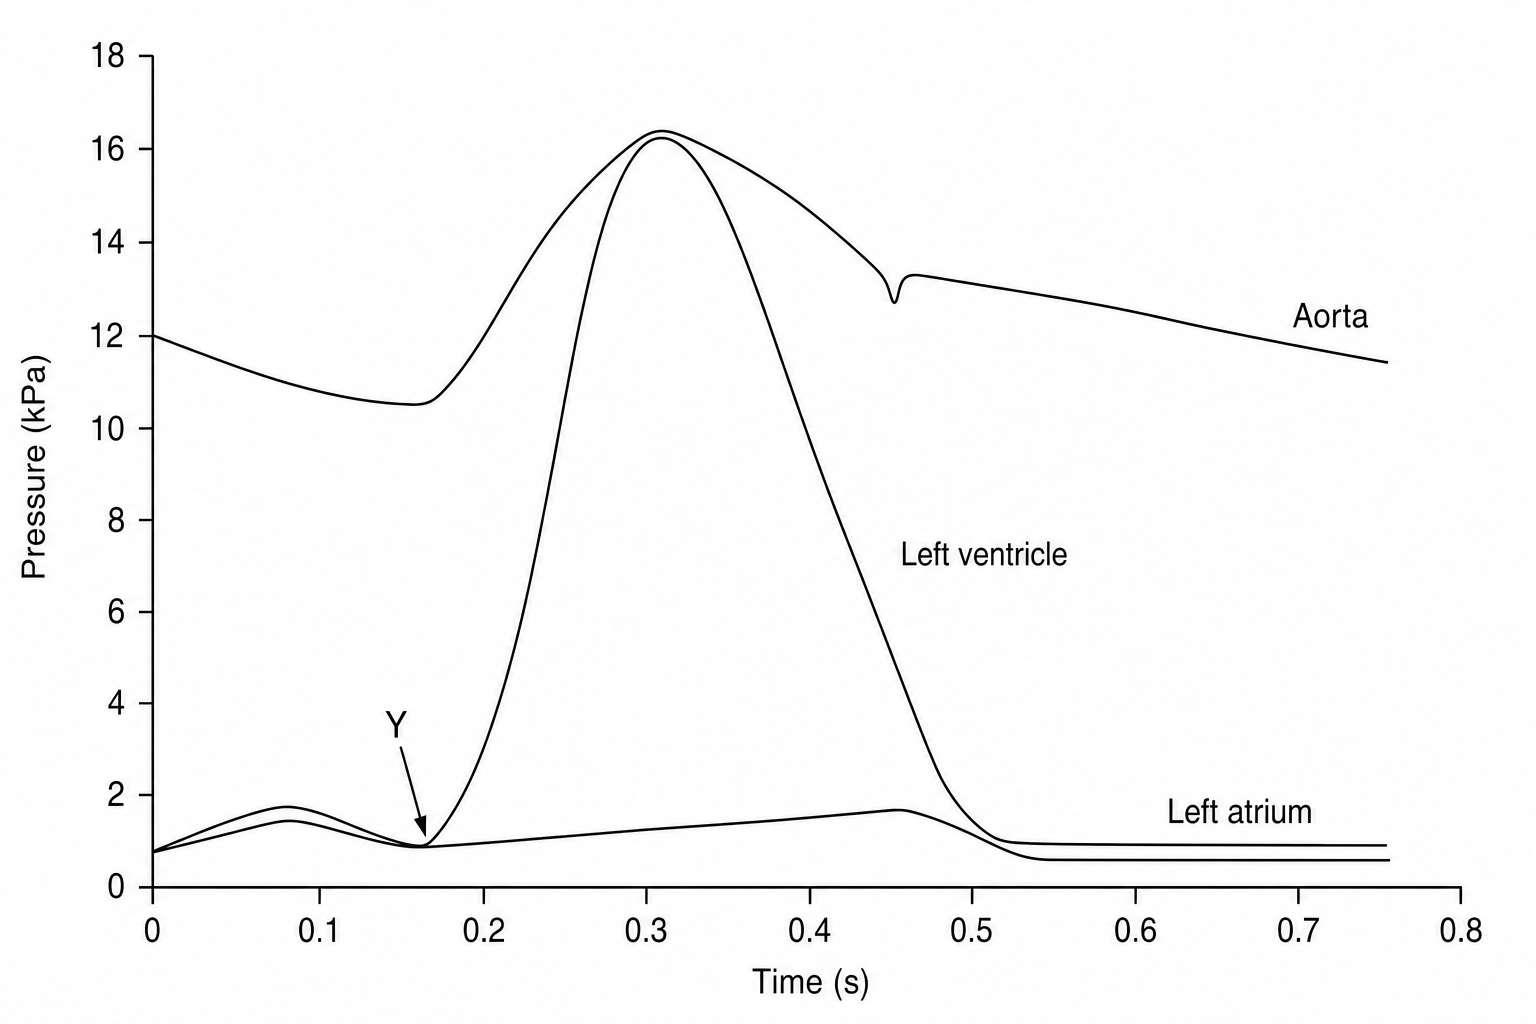
The graph below shows pressure changes in the left side of the heart during a cardiac cycle.


![A line graph showing pressure changes in the left side of the heart during one cardiac cycle of 0.75 seconds. The x-axis is labeled 'time (s)' and ranges from 0 to 0.8 in increments of 0.1. The y-axis is labeled 'pressure (kPa)' and ranges from 0 to 18 in increments of 2. Three curves are plotted:

  1. 'aorta': starts at 12 kPa at time 0 s, decreases gradually to 10.5 kPa at time 0.15 s, then rises sharply with the left ventricle curve, reaching a peak of 16.0 kPa at time 0.32 s. It then decreases to a small notch of 13.0 kPa at time 0.44 s, before continuing a gradual decline back to 11.5 kPa at 0.75 s.
  2. 'left ventricle': starts at 0.5 kPa at time 0 s, rises slightly to 1.5 kPa at time 0.08 s, drops to 0.5 kPa at time 0.15 s. Under point Y (marked at 0.15 s), it rises extremely sharply to peak at 16.2 kPa at time 0.32 s, then falls sharply to 0.5 kPa at time 0.48 s, where it remains low near 0.2 kPa until 0.75 s.
  3. 'left atrium': starts at 0.5 kPa at time 0 s, rises to 1.8 kPa at 0.08 s, drops to 0.5 kPa at 0.15 s, then rises very gradually to about 1.5 kPa at 0.45 s before dropping back to 0.5 kPa at 0.5 s, remaining low until 0.75 s. A label 'Y' with an arrow points to the intersection of the left ventricle and left atrium curves at time 0.15 s, where the left ventricular pressure rises above the left atrial pressure.](https://assets.mathsgenie.co.uk/aqa-qb/934ff389-ea45-4231-a903-2d69a7db641a.png)
a.

Compare the changes in pressure in the left ventricle with the changes in pressure in the left atrium.

[3]
b.

Using the graph, calculate the heart rate of this individual in beats per minute (bpm). Give your answer to 2 significant figures.

[2]
c.

Calculate the percentage increase between the minimum and maximum pressure in the aorta. Give your answer to 2 significant figures.

[3]
d.

Name the valve which closes at point Y.

[1]

Transport in animals Questions

  1. A Level
  2. /Biology
  3. /Transport in animals