Organisms have evolved different types of haemoglobin, each with oxygen-binding properties adapted to their specific environmental niches. Furthermore, physiological changes within an individual organism, such as the Bohr effect, can dynamically alter haemoglobin’s affinity for oxygen.
The graph below displays three oxygen dissociation curves under different conditions, labeled Curve X, Curve Y, and Curve Z.
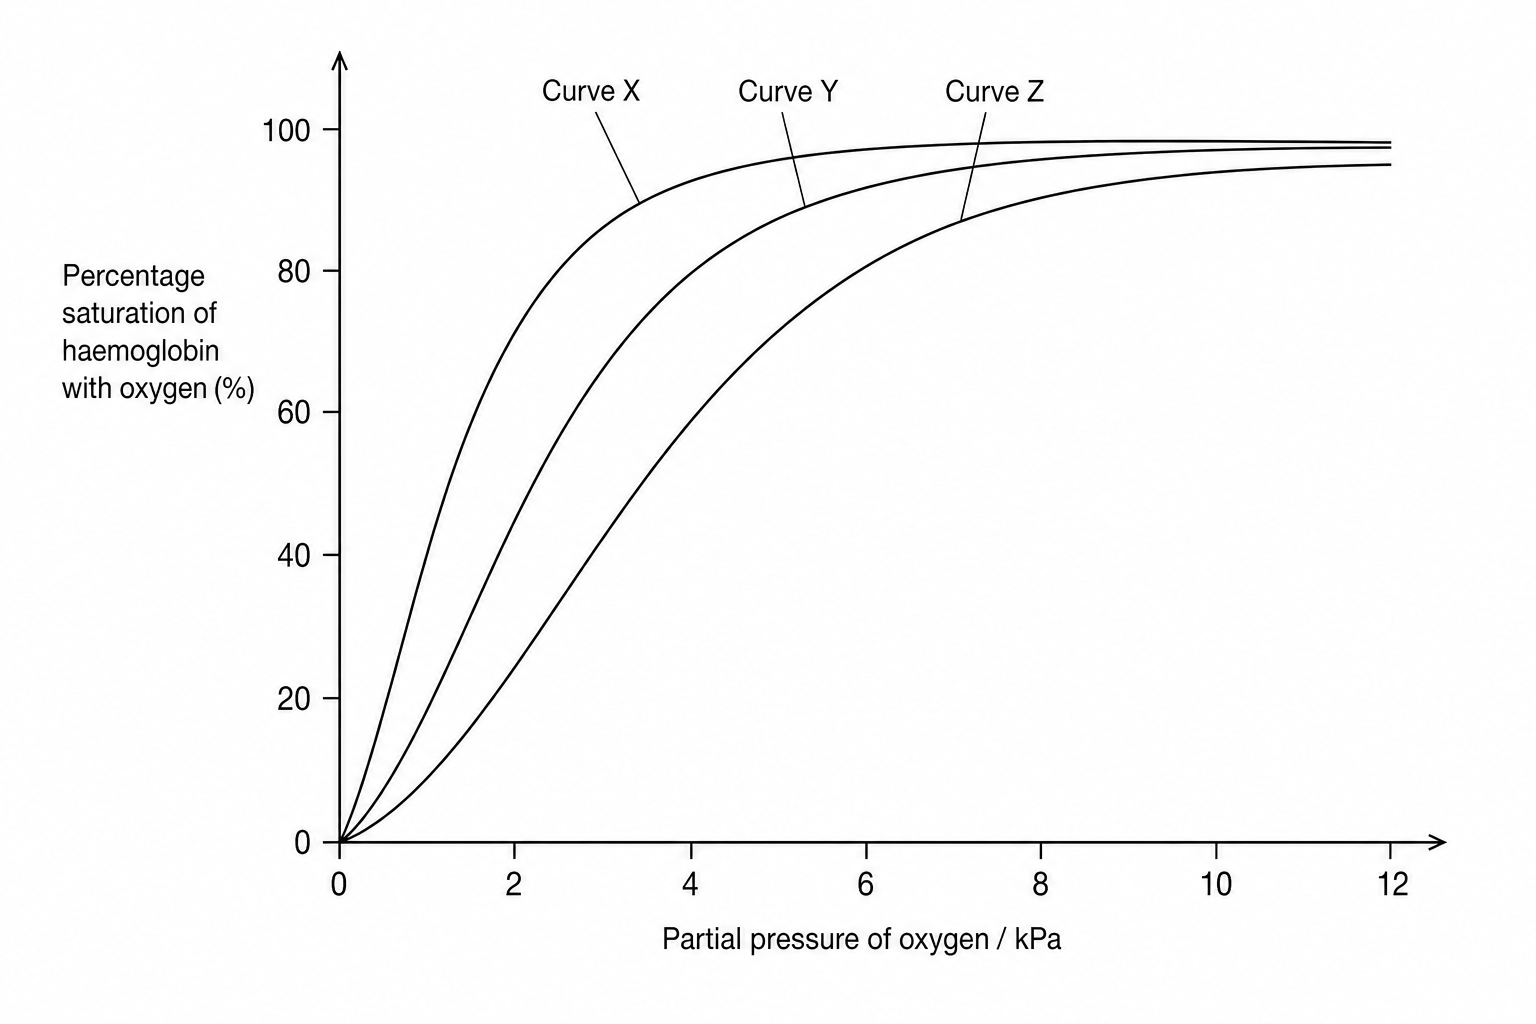
Which of the following rows correctly identifies the conditions or organisms represented by Curve X, Curve Y, and Curve Z?
Curve X: human haemoglobin at pH 7.2pH\ 7.2pH 7.2; Curve Y: human haemoglobin at pH 7.4pH\ 7.4pH 7.4; Curve Z: llama haemoglobin
Curve X: llama haemoglobin; Curve Y: human haemoglobin at pH 7.2pH\ 7.2pH 7.2; Curve Z: human haemoglobin at pH 7.4pH\ 7.4pH 7.4
Curve X: llama haemoglobin; Curve Y: human haemoglobin at pH 7.4pH\ 7.4pH 7.4; Curve Z: human haemoglobin at pH 7.2pH\ 7.2pH 7.2
Curve X: human haemoglobin at pH 7.4pH\ 7.4pH 7.4; Curve Y: llama haemoglobin; Curve Z: human haemoglobin at pH 7.2pH\ 7.2pH 7.2

